
- Home >
- Stock Photos >
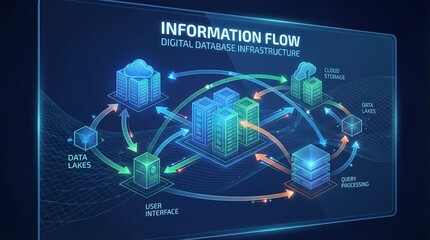
- Digital Interface with Human Portrait and Data Graphs
Digital Interface with Human Portrait and Data Graphs Image

Graphical representation of technology integrating human data processing and analytics. Suited for illustration of futuristic cyber technology and data network designs. Ideal for presentations or articles on digital advancements, artificial intelligence, or cybersecurity trends.
Powered by 


downloads
Tags:
More
Credit Photo
If you would like to credit the Photo, here are some ways you can do so
Text Link
photo Link
<span class="text-link">
<span>
<a target="_blank" href=https://pikwizard.com/photo/digital-interface-with-human-portrait-and-data-graphs/b0ea2d08d619ce98256ad90a04f5d7f0/>PikWizard</a>
</span>
</span>
<span class="image-link">
<span
style="margin: 0 0 20px 0; display: inline-block; vertical-align: middle; width: 100%;"
>
<a
target="_blank"
href="https://pikwizard.com/photo/digital-interface-with-human-portrait-and-data-graphs/b0ea2d08d619ce98256ad90a04f5d7f0/"
style="text-decoration: none; font-size: 10px; margin: 0;"
>
<img src="https://pikwizard.com/pw/medium/b0ea2d08d619ce98256ad90a04f5d7f0.jpg" style="margin: 0; width: 100%;" alt="" />
<p style="font-size: 12px; margin: 0;">PikWizard</p>
</a>
</span>
</span>
Free (free of charge)
Free for personal and commercial use.
Author: Awesome Content
Similar Free Stock Images

Premium

Premium

Premium


Premium


Premium


Premium


Premium


Premium


Premium

Premium

Premium


Premium


Premium


Premium

Premium

Premium


Premium


Premium


Premium


Premium


Premium


Premium


Premium

Premium


Premium
Explore More Free Stock Images