
- Home >
- Stock Photos >
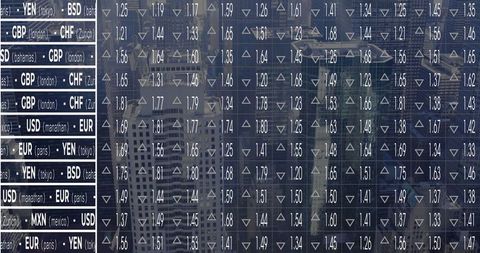
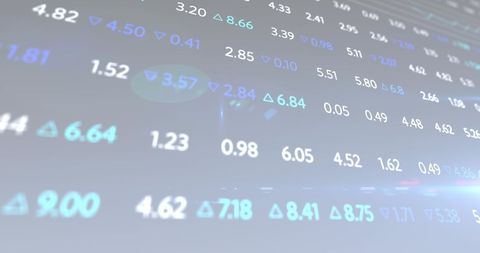
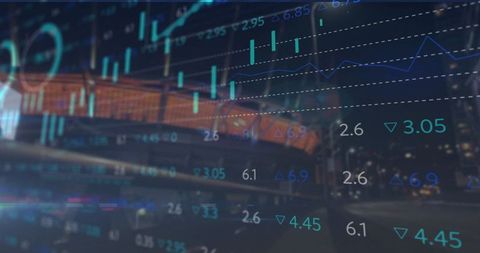
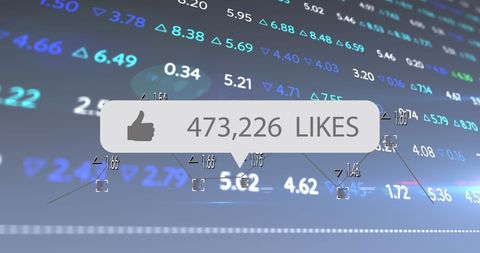
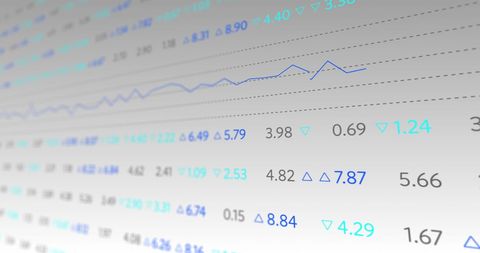
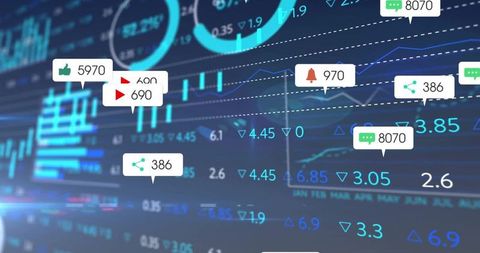
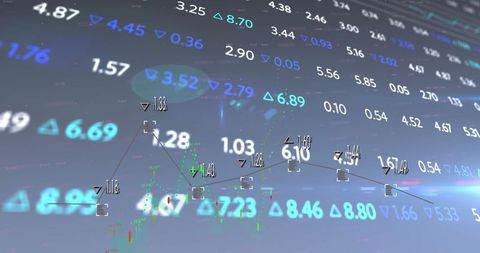
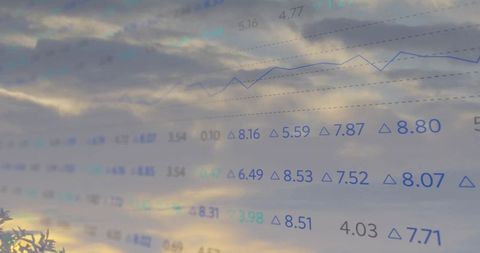
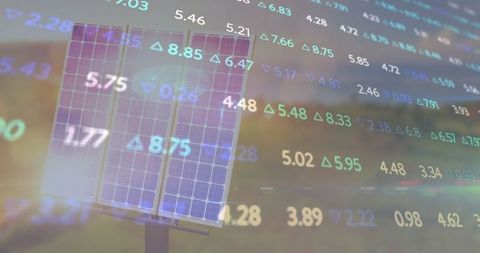
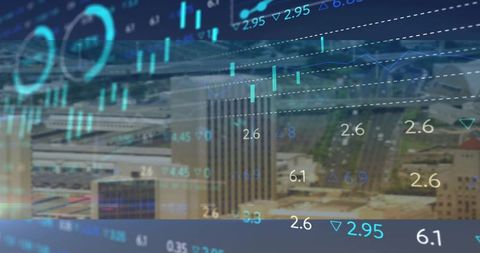
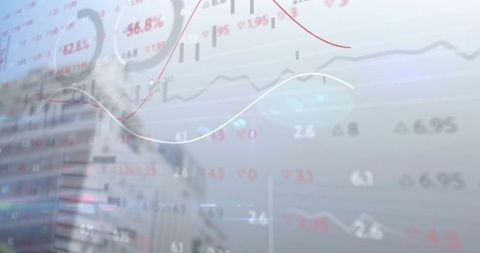
- Digital Interface with Market Metrics and Numeric Visualization
Digital Interface with Market Metrics and Numeric Visualization Image

Data interface provides a futuristic view of market metrics with arrows and numerical values. This technology-driven scene updates in real-time, making it ideal for topics related to stock market analysis, financial reporting, and technology advancements. Businesses can use it to illustrate innovative data visualization tools and analytics applications.
Powered by 


downloads
Tags:
More
Credit Photo
If you would like to credit the Photo, here are some ways you can do so
Text Link
photo Link
<span class="text-link">
<span>
<a target="_blank" href=https://pikwizard.com/photo/digital-interface-with-market-metrics-and-numeric-visualization/04cadfbaac3cf38c13b22253d53d6446/>PikWizard</a>
</span>
</span>
<span class="image-link">
<span
style="margin: 0 0 20px 0; display: inline-block; vertical-align: middle; width: 100%;"
>
<a
target="_blank"
href="https://pikwizard.com/photo/digital-interface-with-market-metrics-and-numeric-visualization/04cadfbaac3cf38c13b22253d53d6446/"
style="text-decoration: none; font-size: 10px; margin: 0;"
>
<img src="https://pikwizard.com/pw/medium/04cadfbaac3cf38c13b22253d53d6446.jpg" style="margin: 0; width: 100%;" alt="" />
<p style="font-size: 12px; margin: 0;">PikWizard</p>
</a>
</span>
</span>
Free (free of charge)
Free for personal and commercial use.
Author: Awesome Content
Similar Free Stock Images

Premium


Premium

Premium


Premium


Premium


Premium


Premium

Premium


Premium


Premium


Premium

Premium

Premium

Premium


Premium


Premium

Premium


Premium


Premium


Premium


Premium


Premium

Premium


Premium


Premium

Explore More Free Stock Images