- Home >
- Stock Photos >
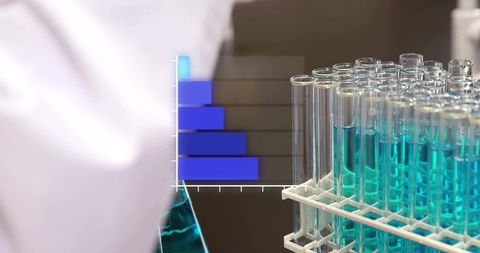
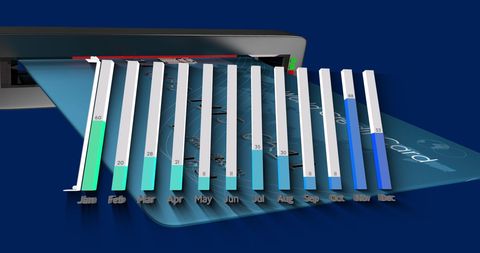
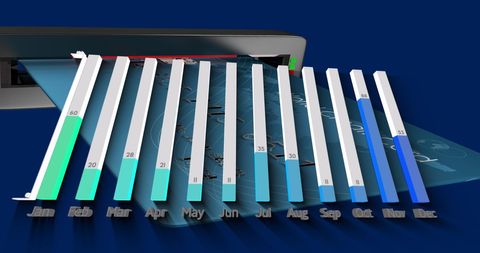
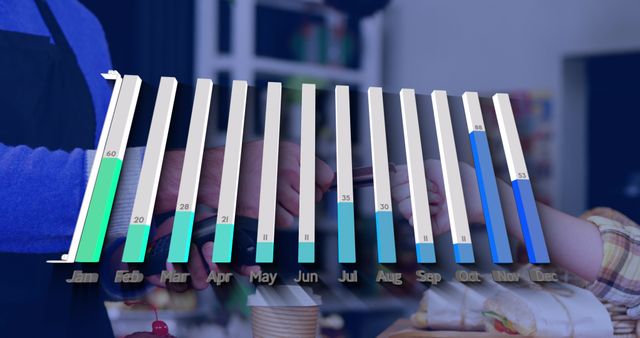
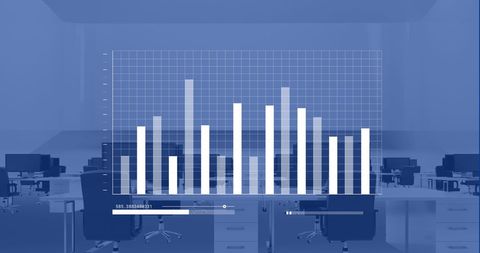
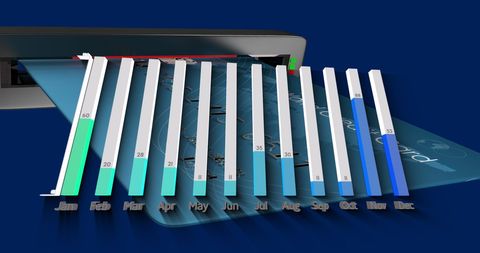
- Digital Interface with Monthly Progress Graph Bars
Digital Interface with Monthly Progress Graph Bars Image
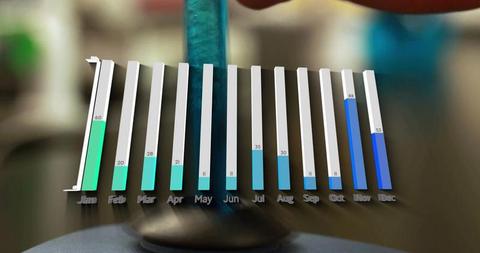
Abstract visualization shows vibrant digital interface with bar graphs indicating monthly data progression. Blue graphical elements add futuristic feel to laboratory scene. Useful for technology presentations, data analysis themes, innovative space decorations, or science advertising campaigns.

downloads
Tags:
More
Credit Photo
If you would like to credit the Photo, here are some ways you can do so
Text Link
photo Link
<span class="text-link">
<span>
<a target="_blank" href=https://pikwizard.com/photo/digital-interface-with-monthly-progress-graph-bars/b5807edb7701f131edaf13e6a2f5cee6/>PikWizard</a>
</span>
</span>
<span class="image-link">
<span
style="margin: 0 0 20px 0; display: inline-block; vertical-align: middle; width: 100%;"
>
<a
target="_blank"
href="https://pikwizard.com/photo/digital-interface-with-monthly-progress-graph-bars/b5807edb7701f131edaf13e6a2f5cee6/"
style="text-decoration: none; font-size: 10px; margin: 0;"
>
<img src="https://pikwizard.com/pw/medium/b5807edb7701f131edaf13e6a2f5cee6.jpg" style="margin: 0; width: 100%;" alt="" />
<p style="font-size: 12px; margin: 0;">PikWizard</p>
</a>
</span>
</span>
Free (free of charge)
Free for personal and commercial use.
Author: Creative Art