- Home >
- Stock Photos >
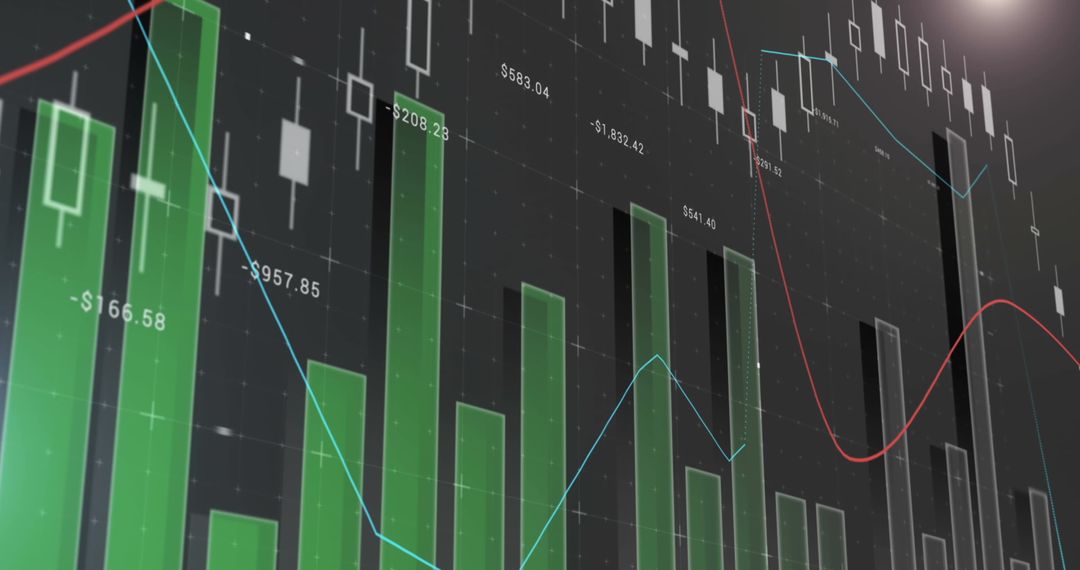
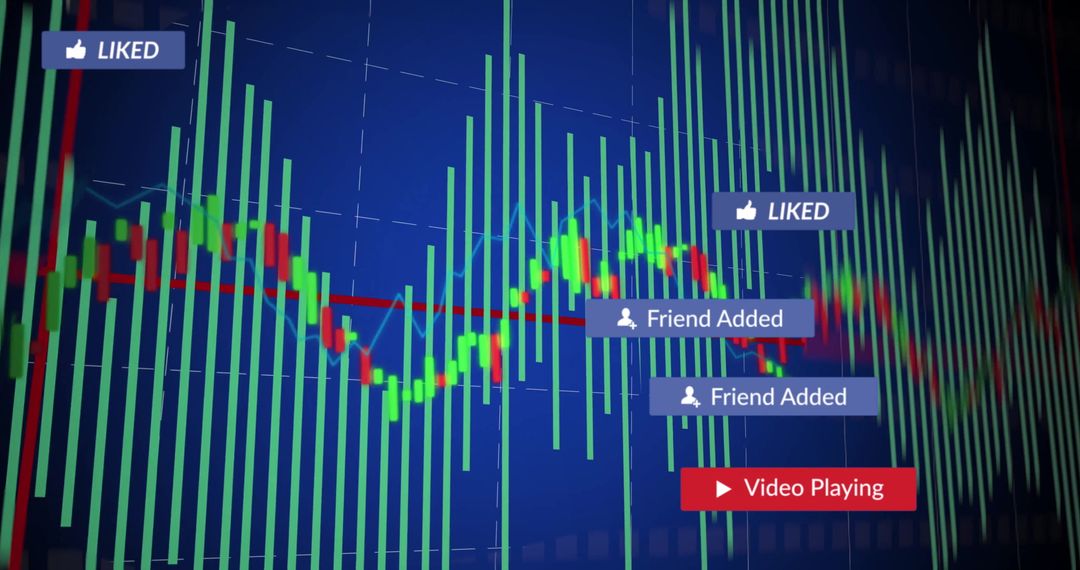
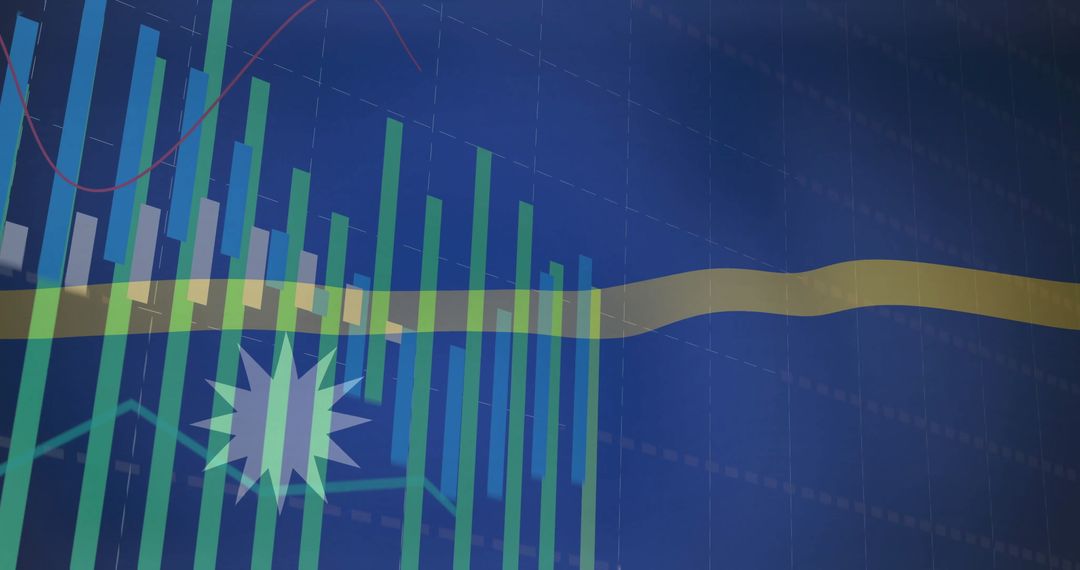
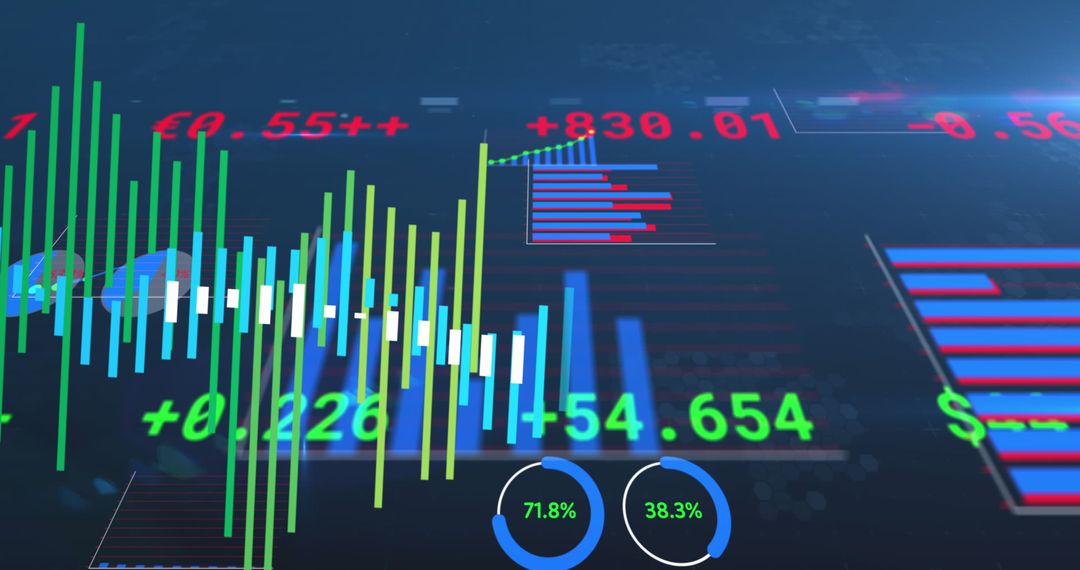
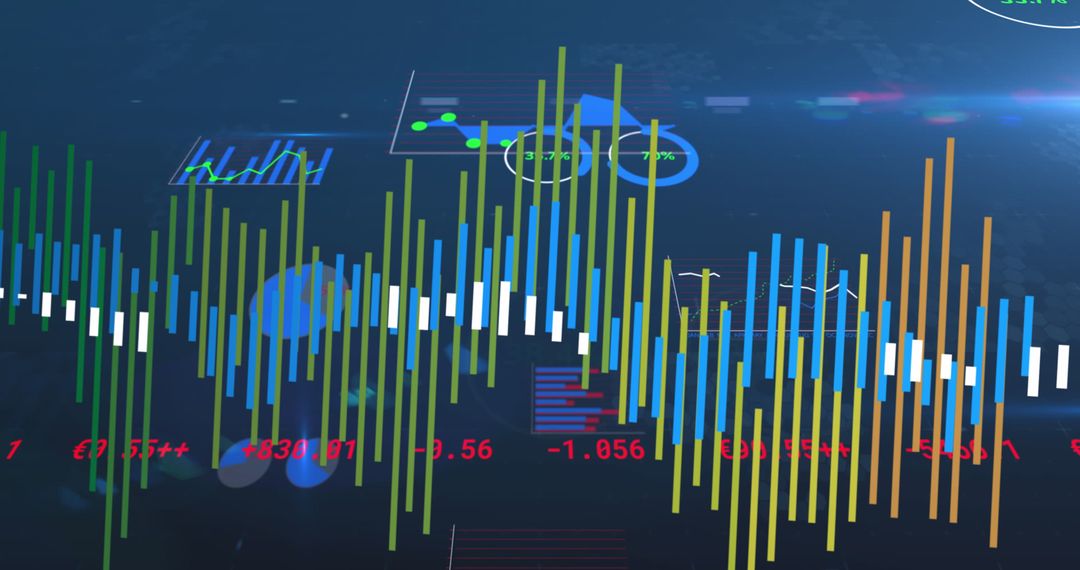
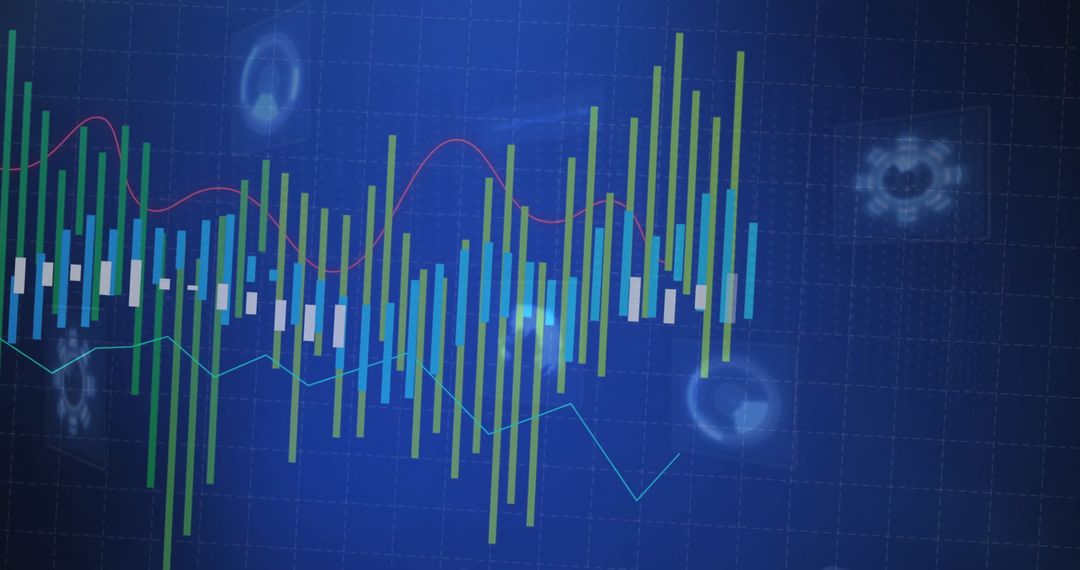
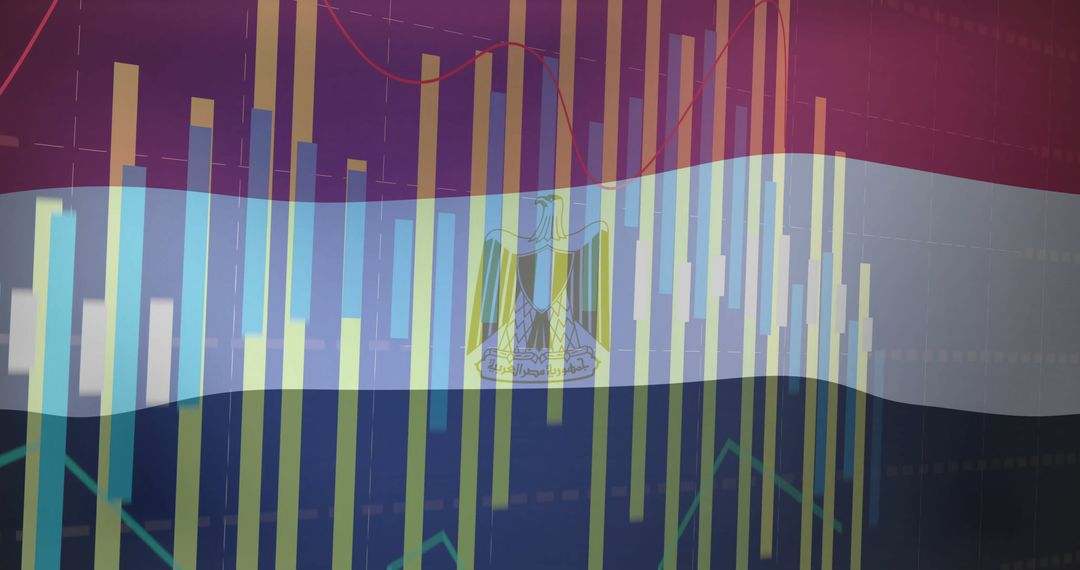
- Digital Interface with Rising Bar Graphs and Trend Lines
Digital Interface with Rising Bar Graphs and Trend Lines Image

Depicts rising green and blue bars on blue grid with red trend line and digital icons. Ideal for illustrating financial growth, market analyses, or global economic trends. Suitable for presentations on data analytics, finance software, or tech interface design concepts.
Powered by 


0
downloads
downloads
Tags:
More
Credit Photo
If you would like to credit the Photo, here are some ways you can do so
Text Link
photo Link
<span class="text-link">
<span>
<a target="_blank" href=https://pikwizard.com/photo/digital-interface-with-rising-bar-graphs-and-trend-lines/1b55abfbc96a1d439ab8e19ff80181bc/>PikWizard</a>
</span>
</span>
<span class="image-link">
<span
style="margin: 0 0 20px 0; display: inline-block; vertical-align: middle; width: 100%;"
>
<a
target="_blank"
href="https://pikwizard.com/photo/digital-interface-with-rising-bar-graphs-and-trend-lines/1b55abfbc96a1d439ab8e19ff80181bc/"
style="text-decoration: none; font-size: 10px; margin: 0;"
>
<img src="https://pikwizard.com/pw/medium/1b55abfbc96a1d439ab8e19ff80181bc.jpg" style="margin: 0; width: 100%;" alt="" />
<p style="font-size: 12px; margin: 0;">PikWizard</p>
</a>
</span>
</span>
Free (free of charge)
Free for personal and commercial use.
Author: Authentic Images
Similar Free Stock Images

Premium


Premium


Premium


Premium


Premium


Premium


Premium


Premium


Premium


Premium


Premium


Premium


Premium


Premium


Premium


Premium


Premium


Premium


Premium


Premium


Premium


Premium


Premium


Premium