1. Home > 
  2. Stock Photos > 
  3. Digital Interface with Sale Graphics and Data Patterns

Digital Interface with Sale Graphics and Data Patterns Image

Digital Interface with Sale Graphics and Data Patterns

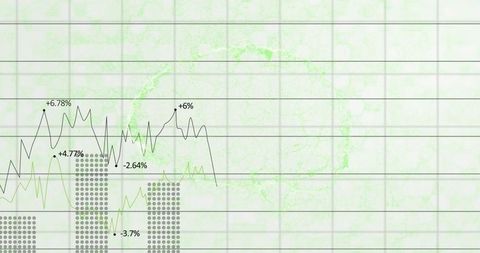
Depicting the integration of sale metrics and digital patterns, this image is ideal for illustrating concepts related to digital marketing strategies in business presentations or articles on technology’s role in sales analytics. The use of vibrant graphics against a backdrop of data visualizations communicates the dynamic and complex nature of modern commerce and technological impact.

Powered by Shutterstock logo - Get 15% off with code: PIKWIZARD15
CRM system and customer relationship management concept with business analytics dashboard and data visualization. Ideal for marketing, sales strategy and SaaS platforms. - Powered by Shutterstock - Get 15% off with code: PIKWIZARD15Hand using smartphone with floating online shopping icons, product offers, and "Buy Now" button, symbolizing digital retail, ecommerce discounts, and interactive mobile shopping experience. - Powered by Shutterstock - Get 15% off with code: PIKWIZARD15Property management and checklist evaluation concept. businessman using tablet to manage digital real estate assets, analyze housing data, property investment decision making and asset approval. - Powered by Shutterstock - Get 15% off with code: PIKWIZARD15Real estate agent using digital property listing interface for selling houses, analyzing market data, and managing housing investment opportunities in a smart real estate business. - Powered by Shutterstock - Get 15% off with code: PIKWIZARD15Market research, Business analysis. Businessman using digital tablet analyzing digital marketing data and financial report for online marketing plan and strategy, business intelligence and development - Powered by Shutterstock - Get 15% off with code: PIKWIZARD15

Credit Photo

If you would like to credit the Photo, here are some ways you can do so

Free (free of charge)

Free for personal and commercial use.

Author: People Creations

Similar Free Stock Images

Financial Data Over Electric Sky Concept for Energy Sector
Premium
Sales and marketing analysis digital research concept. Analyst analytics data dashboard. Data report management. System integration technology. Tech business software. Erp system. Market research.
Displaying data dashboard with circular progress rings, teal bars and lavender trend line
Premium
Digital shopping analysis concept. A person interacts with a laptop displaying digital shopping analytics, customer reviews, and AI-driven e-commerce tools on a virtual interface.
Financial Data Analysis on Digital Display
Dynamic Data Analytics Interface Showing Statistical Trends
Digital Security and Financial Data Trends
Dynamic Financial Data Charts and Digital Interface Concepts
Premium
AI transforms ecommerce by enabling smart product recommendations, AI automated shopping decisions, and AI-powered ecommerce analytics to optimize customer experience and AI ecommerce success. Muxer
Premium

Lead Generation: Businessman holding virtual interface panel of digital device on global networking, automation, prospecting, analytics, conversion, and marketing technology in futuristic.
Digital Graphs and Charts on Tech Background Illustrating Data Analysis
Premium
CRM platforms improve customer relationships through data analysis, CRM communication tools, and automation. CRM systems support customer management,  tracking, and CRM relationship success. Muxer
Rising Graphs and Interactive Financial Data Analytics Background
Stock Market Analysis with Graphs and Trading Data
Digital Financial Graph with Rising Line Trend on Dark Background
Futuristic Data Visualization with Teal Nodes and Stock Charts
Premium
subscription, management, recurring, billing, A person managing digital subscription plans on a virtual interface, representing recurring billing, finance management, and service automation.
Digital Financial Data Display with Graphs and Analytics
Financial Data Analytics on Digital Interface
Financial Data Information with Graphs and Charts for Stock Market Analysis
Digital Fintech Visualization with Graphs and Data Icons
Premium
A hand selecting a profile icon with various business and communication app icons in the background, representing digital customer relationship management.
Digital Financial Data Display with Analytical Charts
Premium
Futuristic interface showing marketing strategy icons and data graphics above an open hand, glowing holographic style on dark background, business concept
Rising Financial Graph on Purple Background
Graph and Chart Display on White Grid Background
Stock Market Analysis and Data Processing Graphic
Digital Data Analysis with Network Connections on a Grid Background
Premium
Business analytics with charts, Business people use computers to analyze business and manage corporate data in office, Financial and marketing strategy, KPIs to improve organizational performance.
Stock Market Analysis Digital Screen with Graphs and Trends
Digital Financial Data Stream with Numeric Overlay
Dynamic Stock Market Graphs Showing Fluctuating Trends
Dynamic Financial Growth Chart on Digital Screen
Digital Finance Graphs Showing Market Trends
Dynamic Global Financial Analytics with Rising Graph Visualization
Digital Financial Graphs and Data Analysis Visualization
Abstract Pink Bar Graph Over Digital Grid Background
Dynamic Stock Market Analysis Concept Artwork
Premium
Artificial intelligence chatbot with shopping cart symbolizing e-commerce, online retail, digital marketing and automated customer service for future business solutions.
Green Line Graph Overlaid on Empty Office with Data Overlay
Dynamic Financial Data Charts on Dark Digital Background
Dynamic Financial Data Graphs Networking in Global Business
Global Financial Data Processing with Graphs and Charts on Dark Background
Digital Icons on Data Grid Network Depicting Business Concepts
Premium
Digital marketing sales funnel and customer journey concept. Interacts with a virtual interface displaying a five-step sales funnel: awareness, consideration, conversion, loyalty and advocacy.
Premium
Professional woman interacting with digital sales dashboard displaying various charts and graphs in modern office
Digital Financial Data Visualization on Grid Display
Dynamic Statistical Data Over Grid Network Isolated on White
Financial Data Visualization with Growing Business Charts
Premium
A person holds a smartphone with a glowing checkmark icon surrounded by document icons hovering above it.
Premium
The future of business intelligence is a conversational AI for data analysis. This AI chatbot can analyze sales data from various dashboards. Motif
Financial Data Processing with Graphs and Charts Background
Dynamic Data Visualization with Virtual Graphs and Numbers
Neon Circle Highlights Bullish Trend on Digital Dashboard
Digital Fingerprint Overlayed on Financial Data Illustrating Cybersecurity
Premium
Businessman analyzing KPI dashboard and data analytics using AI technology, showing charts, graphs, and performance indicators for digital strategy, business intelligence, and data visualization.
Dynamic Financial Data Analysis Illustration
Global Financial Analytics on Digital World Map
Encrypted Data Transfer and Digital Interface Technology
Digital Data Analysis with Futuristic Charts
Premium
Real estate AI assistant on tablet, chatbot for smart property management, automation, data-driven marketing and housing business technology innovation.
Dynamic Stock Market Ticker and Graph Analysis
Eco Data Visualization with Environmental Icons and Graphs
Financial Data Market Chart Analysis with Digital Overlay
Premium
Omni channel technology of online retail business concept. Person use laptop with retail marketing icon for channel E-commerce shopping. online retail shopping and omni digital app.
Diverse Graphs and Data Over Urban Landscape
Premium
Multiple hands interacting with digital business dashboard featuring real-time analytics, data visualization, and futuristic glowing interface. Concept of business, technologies, data, engineering. Ad
Dynamic Stock Market Analysis with Blue Graphs and Percentages
Premium
CRM platforms improve customer relationships through data analysis, CRM communication tools, and automation. CRM systems support customer management, tracking, and CRM relationship success. Spline
Dynamic Financial Data Analysis with Virtual Screen
Digital Interface with Overlapping Code and Graph
Digital Projection of Financial Data with Bar Graphs
Digital Data Processing with Technology Interface on Blue Background
Dynamic Stock Market Graphs and Financial Data Visualization
Premium
Management data System KPI connected in database for follow earnings,operations and sales data.Businessman using KPI dashboard.Financial business data analytics graph dashboard.
Dynamic Financial Graphs Illustrating Business Growth
Dynamic Financial Data Dashboard with Graphs and Currency Indicators
Analyzing Financial Data with Global Trends and Charts
Abstract Data Chart with Graphical Patterns
Digital Data Analysis and Global Financial Market Indicators
Global Financial Data Processing with Digital Interface Elements
NFT Text Overlay Financial Stock Data on Dark Background
Financial Data Analytics with Graphs and statistics
Economic Impact of Rising Sea Levels and Climate Change
Premium
AI transforms ecommerce by enabling smart product recommendations, AI automated shopping decisions, and AI-powered ecommerce analytics to optimize customer experience and AI ecommerce success. Muxer
Abstract Financial Data Visualization with Global Connections
Digital Visualization of Financial Data
Abstract Digital Data Charts Illustrating Market Trends
Financial Data Analysis with Graph and Connectivity
Premium
AI transforms ecommerce by enabling smart product recommendations, AI automated shopping decisions, and AI-powered ecommerce analytics to optimize customer experience and AI ecommerce success. Muxer
Dynamic Stock Market Graphs and Tickers Displaying Performance
Dynamic Financial Data Visualization on Grid
Digital Icons with Financial Data Overlay on Blue Background
Graph Showing Stock Market Activity and Financial Data Analysis
Abstract Triangular Shape over Stock Market Data Visualization
Holographic Financial Alert Dashboard Showing Danger Warning with Rising Green Trend
Neon Stadium and Data Integration in Digital Interface
Dynamic Data Trends with Line and Bar Graphs
Digital Stock Market Trends and Financial Growth Analysis
Global Financial Market Trends on Digital Screen
Dynamic Digital Interface for Data Analysis and Statistics
Rising Financial Graphs with Digital Data Interface
Digital Data Transfer with Encrypted Processing Banner
Financial Data Analysis with Digital Graph Overlay on Dark Grid
Futuristic Financial Data Analytics with Digital Interface Concept
Futuristic Financial Data Analysis Interface Concept
Dynamic Financial Data Charts and Graphs Background
Dynamic Financial Data Display with Global Networking Theme
Global Networking and Data Visualization Over Stormy Sky
Dynamic Stock Market Data and Cityscape Background
Premium
The future of business intelligence is a conversational AI for data analysis. This AI chatbot can analyze sales data from various dashboards. Motif
Digital Data Analytics Growth Trend with Graphs
Secure Data Analytics with Financial Graphs and Padlock Over Ukraine Flag
Futuristic Digital Financial Analysis with City Background
Dynamic Financial Data Visual Display with Graph Annotations
Data Projection Over Cityscape Indicating Digital Economy
Global Data Analytics with World Map and Bar Graph
Futuristic Interface Highlighting Encrypted Data Transfer
Futuristic Financial Data Analysis with Graphs and Charts
Premium
pipeline, crm, stages, deal, progress, Businessman working with laptop showing CRM pipeline concept, including deal stages, sales progress, and opportunity forecast for digital business management.
Abstract Financial Data with Icon Integration on Blue Background
Stock Market Trends and Data Analysis over Digital Grid
Digital Interface with Data Analysis Graphics on Blue Background
Social Media Metrics Dashboard with Interactive Graphs
Premium
Businessman analyzing financial growth chart on laptop with data graph, planning investment and strategy for company success. Concept of financial analytics, economic growth, and business technology.
Explore More Free Stock Images