- Home >
- Stock Photos >
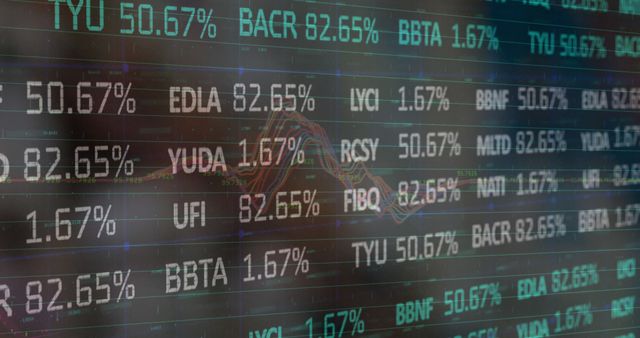
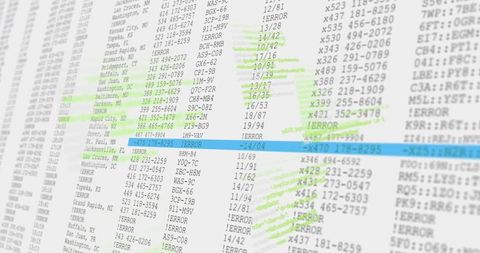
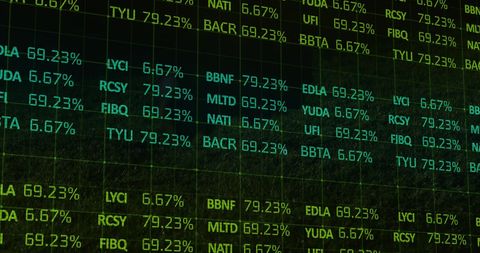
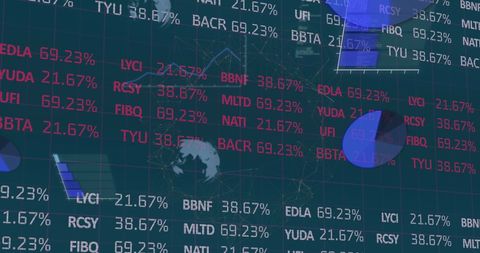
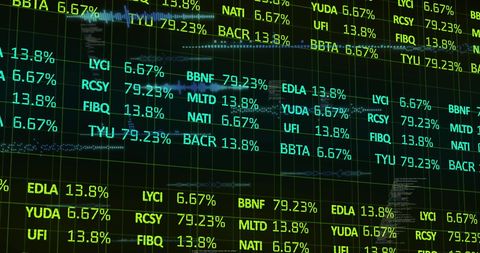
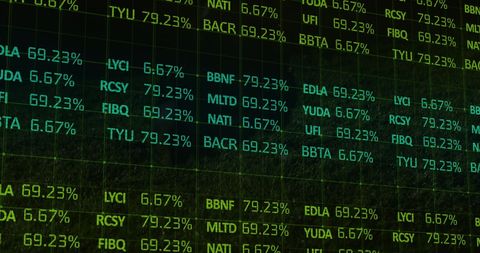
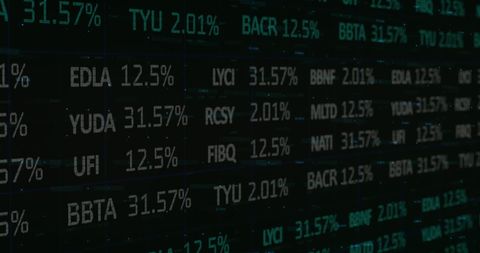
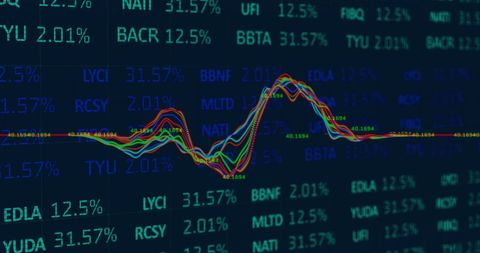
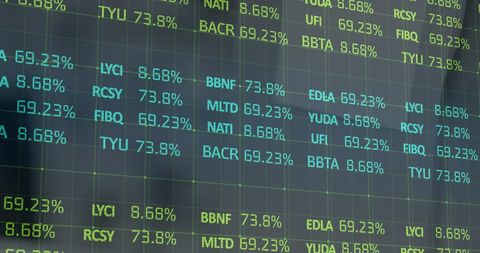
- Digital Interface with Scanning Chart Displaying Stock Data
Digital Interface with Scanning Chart Displaying Stock Data Image

Displaying digital stock data on a dark interface, highlighting stock variances through displayed numbers. Sleek and technology-focused, suitable for articles or promotions related to financial analysis, technology in stock markets, or online security. Illustrates themes of interconnectedness within the global economy applied in tech and finance blog posts or analytics software advertisements.

downloads
Tags:
More
Credit Photo
If you would like to credit the Photo, here are some ways you can do so
Text Link
photo Link
<span class="text-link">
<span>
<a target="_blank" href=https://pikwizard.com/photo/digital-interface-with-scanning-chart-displaying-stock-data/a1b9b5bb74c8682aefe4928aef5a5347/>PikWizard</a>
</span>
</span>
<span class="image-link">
<span
style="margin: 0 0 20px 0; display: inline-block; vertical-align: middle; width: 100%;"
>
<a
target="_blank"
href="https://pikwizard.com/photo/digital-interface-with-scanning-chart-displaying-stock-data/a1b9b5bb74c8682aefe4928aef5a5347/"
style="text-decoration: none; font-size: 10px; margin: 0;"
>
<img src="https://pikwizard.com/pw/medium/a1b9b5bb74c8682aefe4928aef5a5347.jpg" style="margin: 0; width: 100%;" alt="" />
<p style="font-size: 12px; margin: 0;">PikWizard</p>
</a>
</span>
</span>
Free (free of charge)
Free for personal and commercial use.
Author: Awesome Content