- Home >
- Stock Photos >
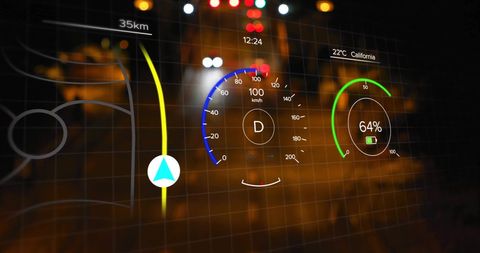
- Digital Interface with Scientific Data Visualization
Digital Interface with Scientific Data Visualization Image

This digital illustration showcases a futuristic science interface filled with animated graphs and data visualizations, illustrating the concept of technological advancement in global science. Perfect for use in presentations on data analytics, tech developments, or digital transformation transitions.

downloads
Tags:
More
Credit Photo
If you would like to credit the Photo, here are some ways you can do so
Text Link
photo Link
<span class="text-link">
<span>
<a target="_blank" href=https://pikwizard.com/photo/digital-interface-with-scientific-data-visualization/5f5e13c3961c41382962f14f9c04d35c/>PikWizard</a>
</span>
</span>
<span class="image-link">
<span
style="margin: 0 0 20px 0; display: inline-block; vertical-align: middle; width: 100%;"
>
<a
target="_blank"
href="https://pikwizard.com/photo/digital-interface-with-scientific-data-visualization/5f5e13c3961c41382962f14f9c04d35c/"
style="text-decoration: none; font-size: 10px; margin: 0;"
>
<img src="https://pikwizard.com/pw/medium/5f5e13c3961c41382962f14f9c04d35c.jpg" style="margin: 0; width: 100%;" alt="" />
<p style="font-size: 12px; margin: 0;">PikWizard</p>
</a>
</span>
</span>
Free (free of charge)
Free for personal and commercial use.
Author: Awesome Content