
- Home >
- Stock Photos >
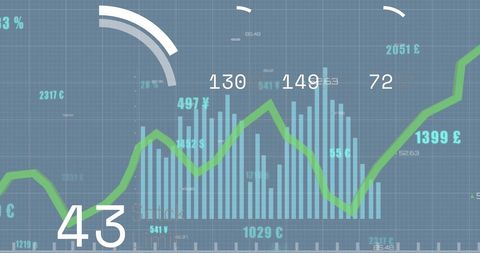
- Digital Interface with Social Interaction Data and Visualization Graphs
Digital Interface with Social Interaction Data and Visualization Graphs Image

Image captures the concept of digital social engagement through technology-driven data representation. The inclusion of chat bubbles with heart icons indicates social media interactions, while wavy graph lines depict dynamic data trends. Perfect for illustrating concepts related to digital communication, technology insights, data analysis in social platforms, and futuristically designed interfaces. Ideal for use in presentations about data-driven decision making, social media marketing strategies or modern technological solutions.
Powered by  - Get 15% off with code: PIKWIZARD15


downloads
Tags:
More
Credit Photo
If you would like to credit the Photo, here are some ways you can do so
Text Link
photo Link
<span class="text-link">
<span>
<a target="_blank" href=https://pikwizard.com/photo/digital-interface-with-social-interaction-data-and-visualization-graphs/8ae6dcaa9ecda6087c480177abe784f0/>PikWizard</a>
</span>
</span>
<span class="image-link">
<span
style="margin: 0 0 20px 0; display: inline-block; vertical-align: middle; width: 100%;"
>
<a
target="_blank"
href="https://pikwizard.com/photo/digital-interface-with-social-interaction-data-and-visualization-graphs/8ae6dcaa9ecda6087c480177abe784f0/"
style="text-decoration: none; font-size: 10px; margin: 0;"
>
<img src="https://pikwizard.com/pw/medium/8ae6dcaa9ecda6087c480177abe784f0.jpg" style="margin: 0; width: 100%;" alt="" />
<p style="font-size: 12px; margin: 0;">PikWizard</p>
</a>
</span>
</span>
Free (free of charge)
Free for personal and commercial use.
Author: Creative Art
Similar Free Stock Images

Premium


Premium


Premium

Premium


Premium


Premium


Premium


Premium


Premium

Premium


Premium


Premium


Premium


Premium


Premium


Premium


Premium


Premium


Premium


Premium


Premium

Premium


Premium


Premium


Premium


Explore More Free Stock Images