
- Home >
- Stock Photos >
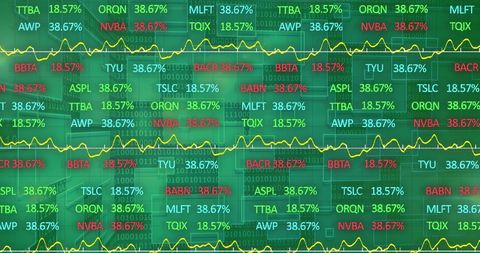
- Digital Interface with Stock Data and Analytics
Digital Interface with Stock Data and Analytics Image

Abstract representation of financial market data with integrated graph lines and digital figures suggesting trend analysis and forecasting. Useful for illustrating financial reports, investment insights, or educational materials on how stock exchanges and modern data processing systems operate. Suitable backdrop for fintech innovation and global economic discussions.
Powered by  - Get 15% off with code: PIKWIZARD15


downloads
Tags:
More
Credit Photo
If you would like to credit the Photo, here are some ways you can do so
Text Link
photo Link
<span class="text-link">
<span>
<a target="_blank" href=https://pikwizard.com/photo/digital-interface-with-stock-data-and-analytics/4e5e4a132c70990c966d1b585f5531d5/>PikWizard</a>
</span>
</span>
<span class="image-link">
<span
style="margin: 0 0 20px 0; display: inline-block; vertical-align: middle; width: 100%;"
>
<a
target="_blank"
href="https://pikwizard.com/photo/digital-interface-with-stock-data-and-analytics/4e5e4a132c70990c966d1b585f5531d5/"
style="text-decoration: none; font-size: 10px; margin: 0;"
>
<img src="https://pikwizard.com/pw/medium/4e5e4a132c70990c966d1b585f5531d5.jpg" style="margin: 0; width: 100%;" alt="" />
<p style="font-size: 12px; margin: 0;">PikWizard</p>
</a>
</span>
</span>
Free (free of charge)
Free for personal and commercial use.
Author: Creative Art
Similar Free Stock Images

Premium


Premium


Premium


Premium


Premium

Premium


Premium

Premium

Premium


Premium

Premium


Premium


Premium


Premium


Premium

Premium


Premium


AI


Premium


Premium


Premium


Premium

Premium


Premium


Premium


Premium

Explore More Free Stock Images