- Home >
- Stock Photos >
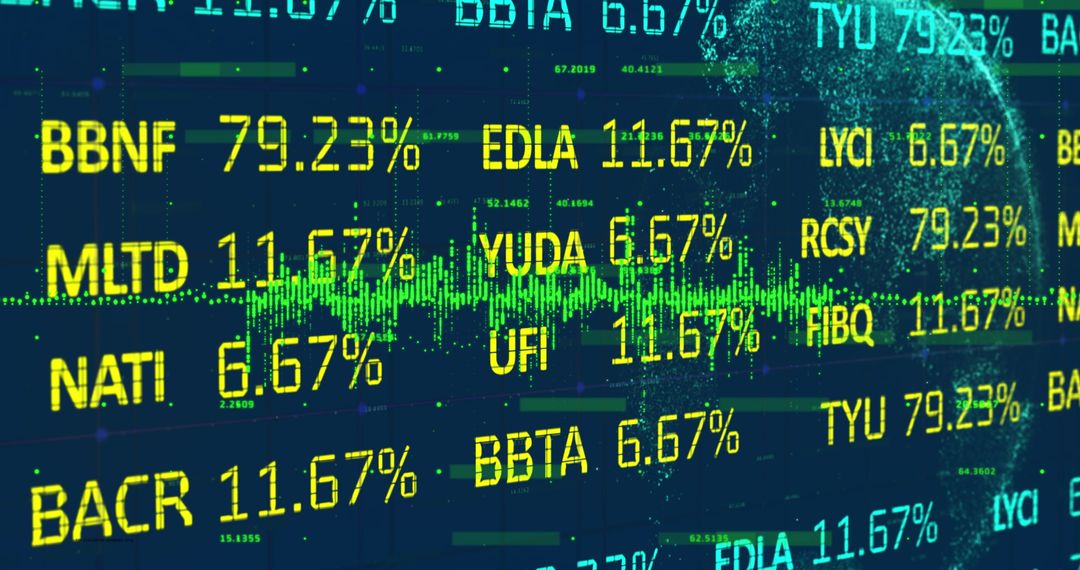
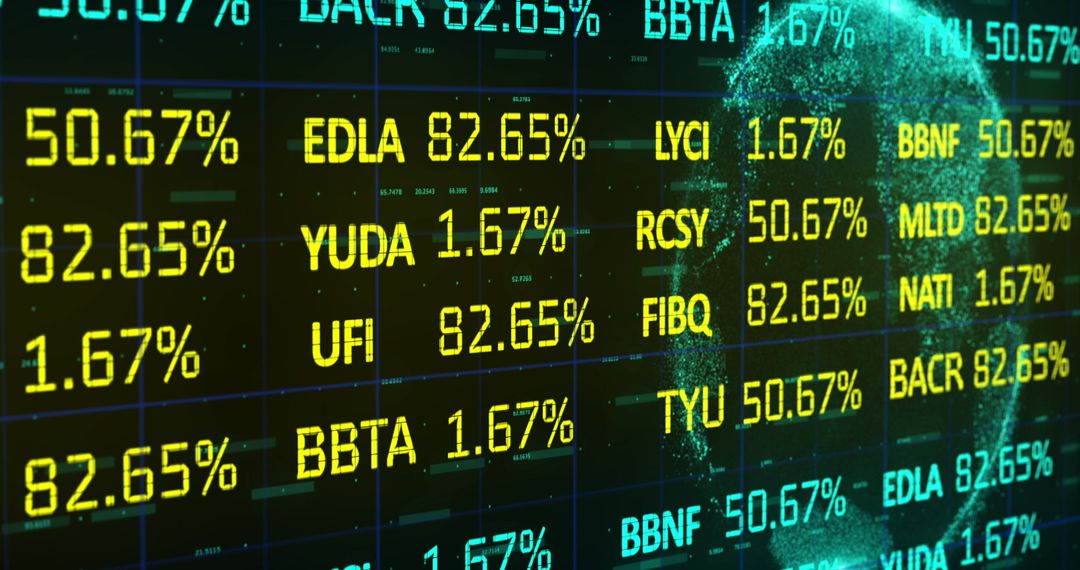
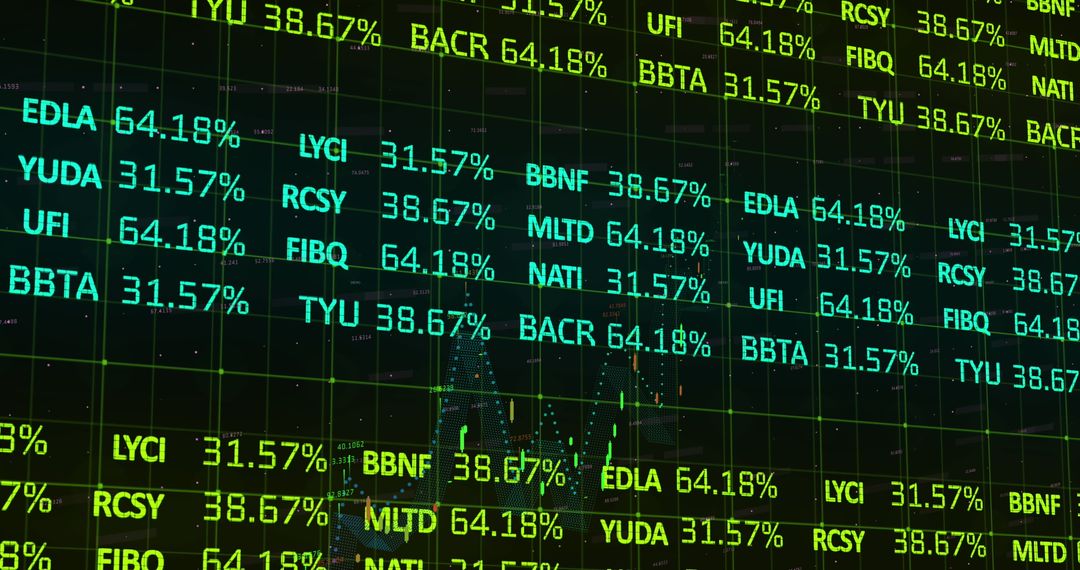
- Digital Interface with Stock Market Data on Globe
Digital Interface with Stock Market Data on Globe Image

Neon-lit digital interface displays global stock market data superimposed over artistic globe representation. Useful for finance-related content, illustrating concepts of global trading, market analysis, or digital innovation in finance sectors. Ideal for articles, presentations, and educational materials involving global economics or stock market insights.
Powered by  - Get 15% off with code: PIKWIZARD15


2
downloads
downloads
Tags:
More
Credit Photo
If you would like to credit the Photo, here are some ways you can do so
Text Link
photo Link
<span class="text-link">
<span>
<a target="_blank" href=https://pikwizard.com/photo/digital-interface-with-stock-market-data-on-globe/5ebb8ea80a2841c90da80624a49c9c41/>PikWizard</a>
</span>
</span>
<span class="image-link">
<span
style="margin: 0 0 20px 0; display: inline-block; vertical-align: middle; width: 100%;"
>
<a
target="_blank"
href="https://pikwizard.com/photo/digital-interface-with-stock-market-data-on-globe/5ebb8ea80a2841c90da80624a49c9c41/"
style="text-decoration: none; font-size: 10px; margin: 0;"
>
<img src="https://pikwizard.com/pw/medium/5ebb8ea80a2841c90da80624a49c9c41.jpg" style="margin: 0; width: 100%;" alt="" />
<p style="font-size: 12px; margin: 0;">PikWizard</p>
</a>
</span>
</span>
Free (free of charge)
Free for personal and commercial use.
Author: Awesome Content
Similar Free Stock Images

Premium


Premium


Premium


Premium


Premium


Premium


Premium


Premium


Premium


Premium


Premium


Premium


Premium


Premium


Premium


Premium


Premium


Premium


Premium


Premium


Premium


Premium


Premium


Premium