- Home >
- Stock Photos >
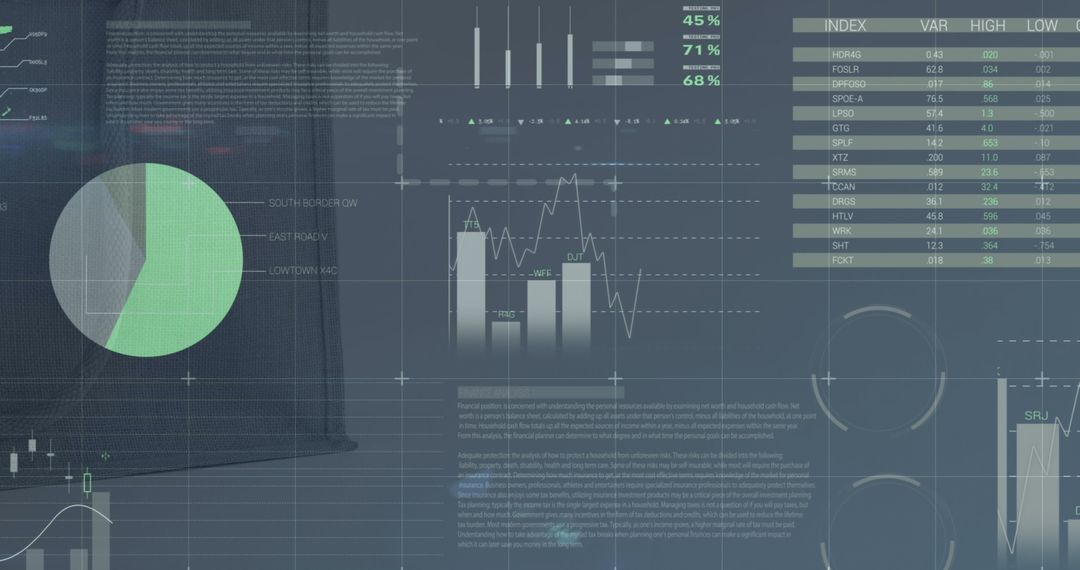
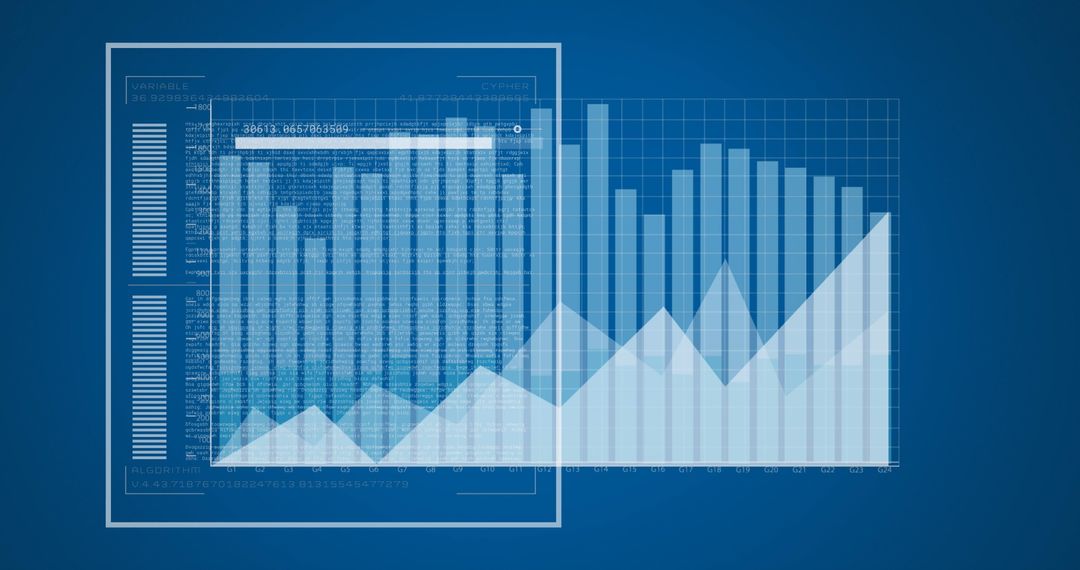
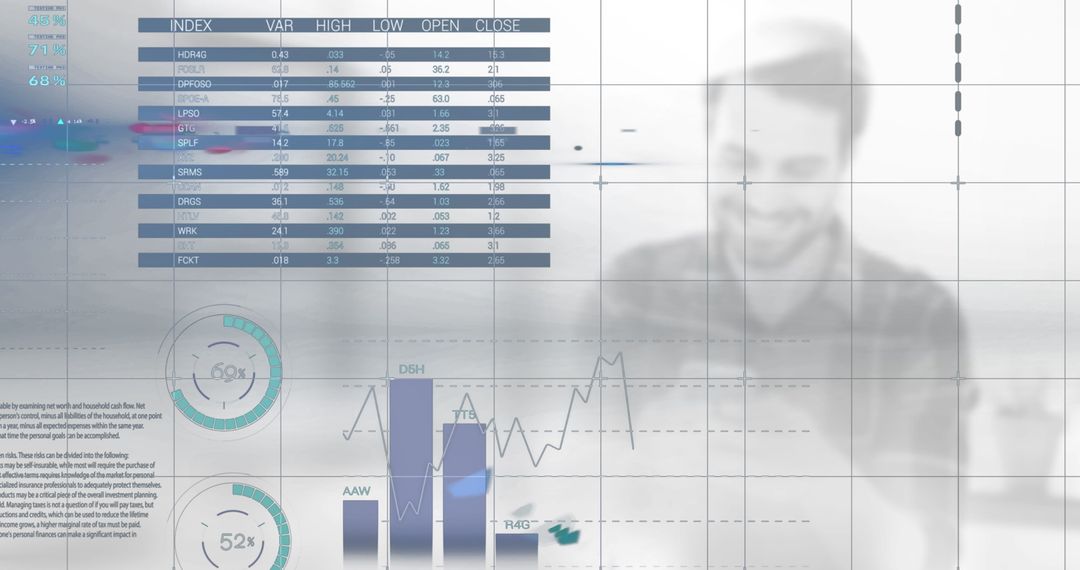
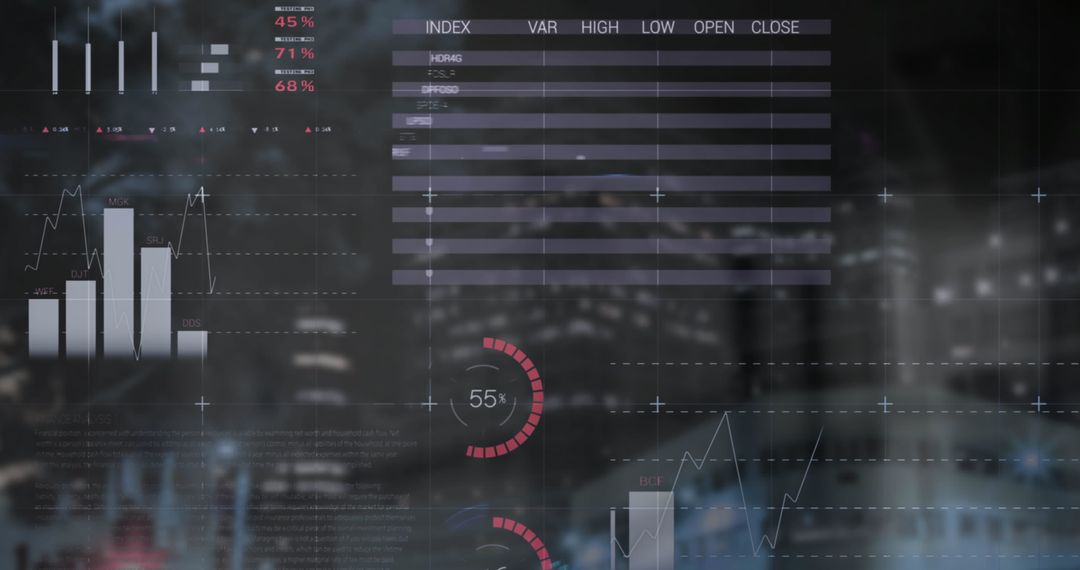
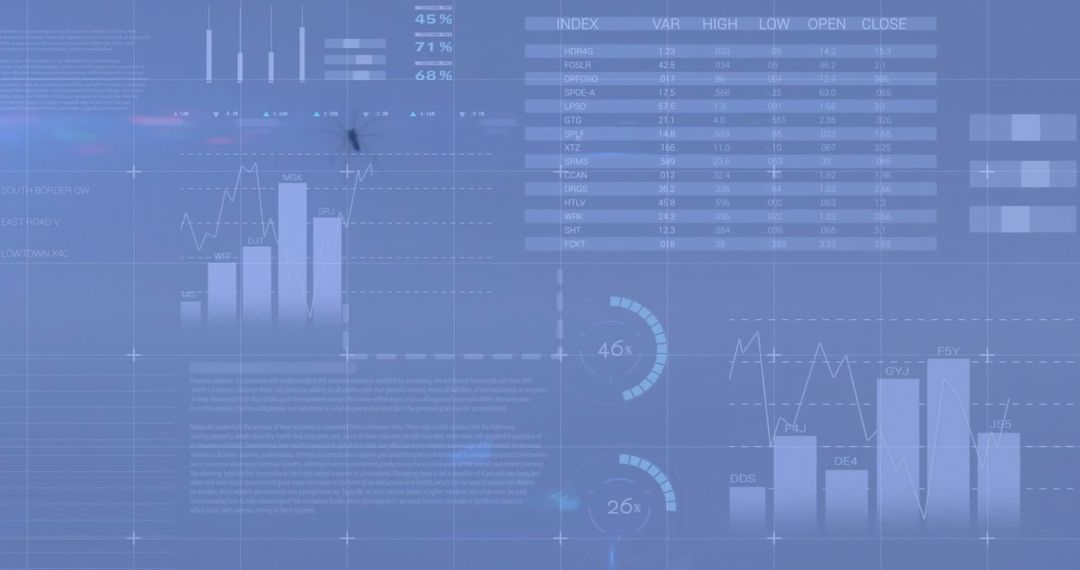
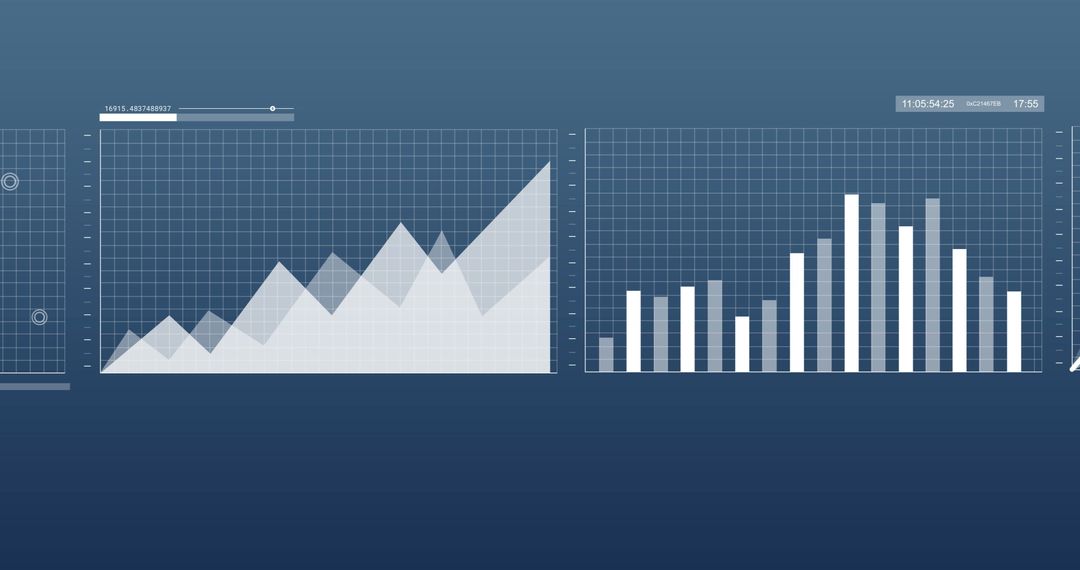
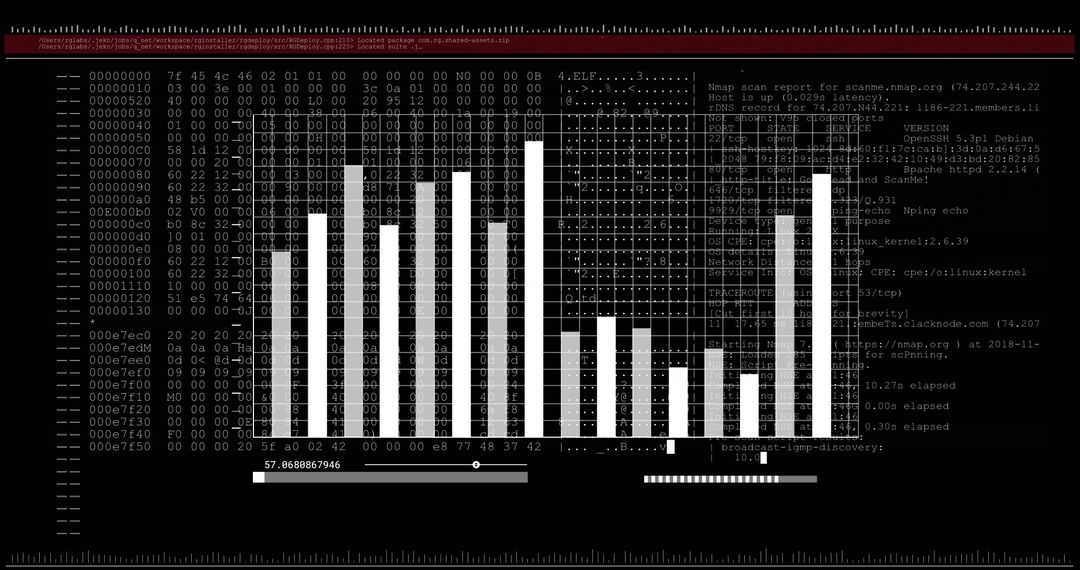
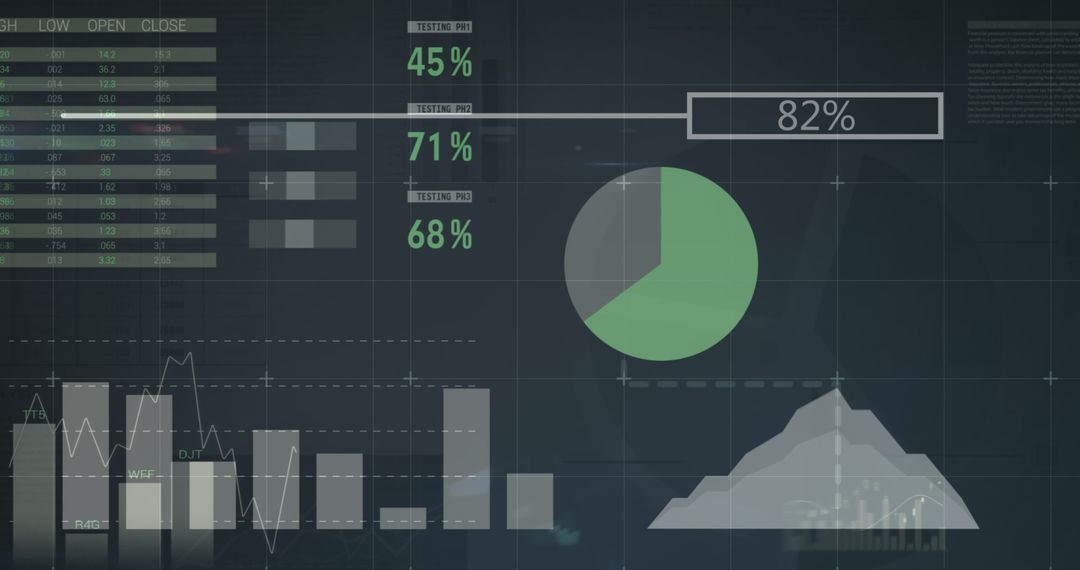
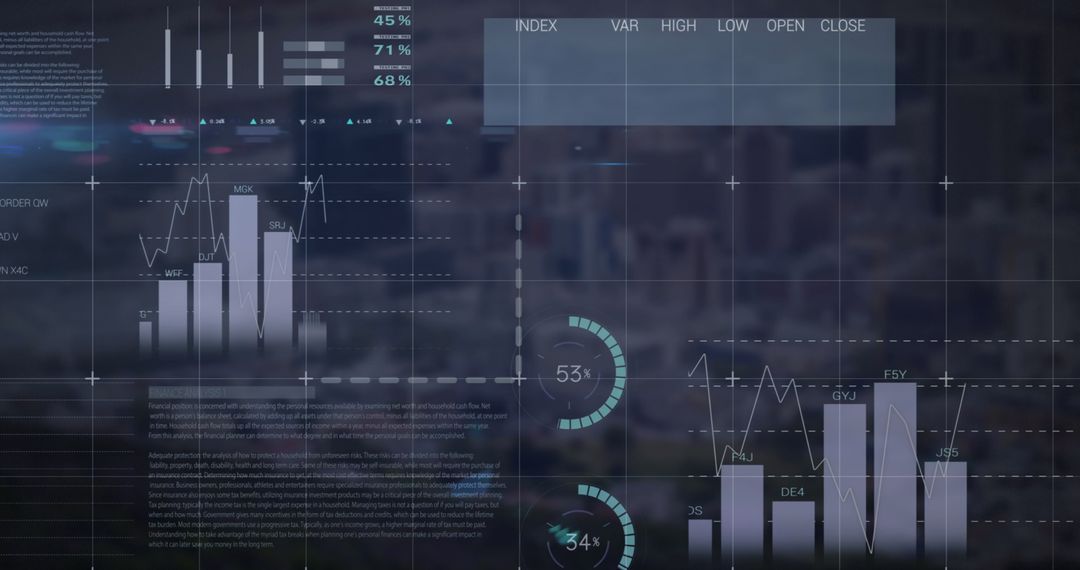
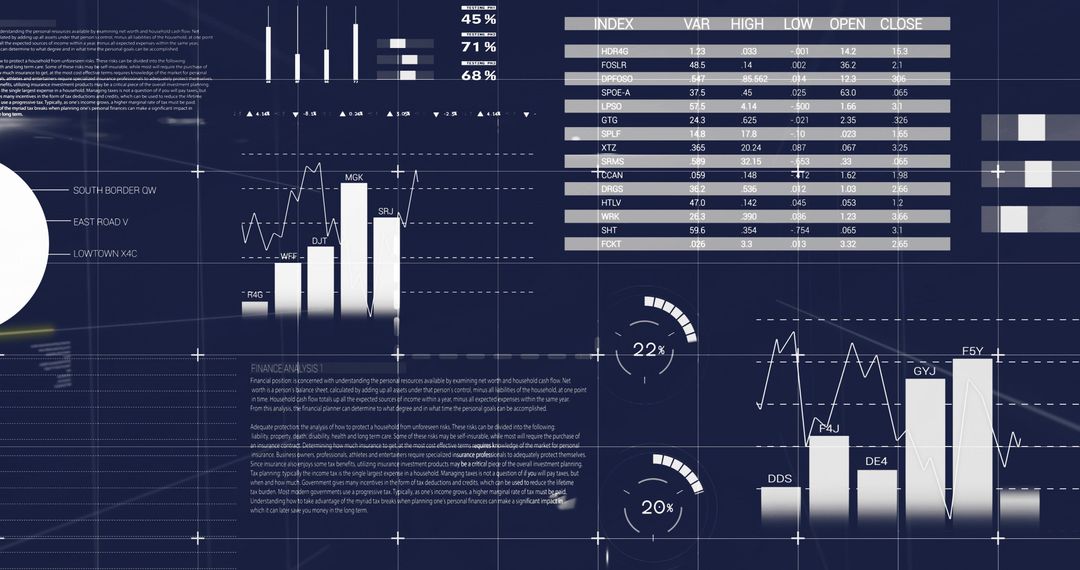
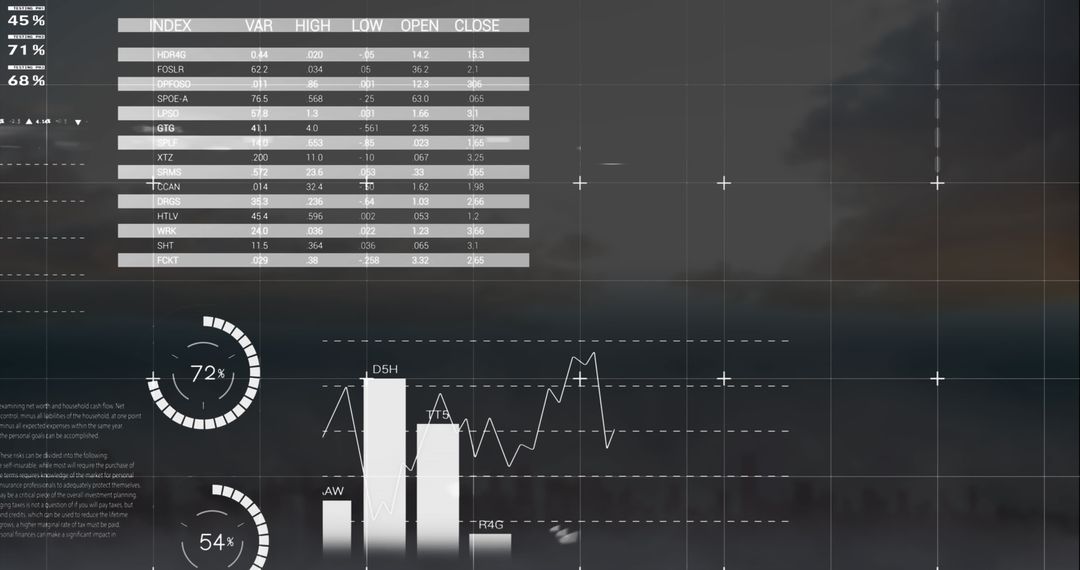
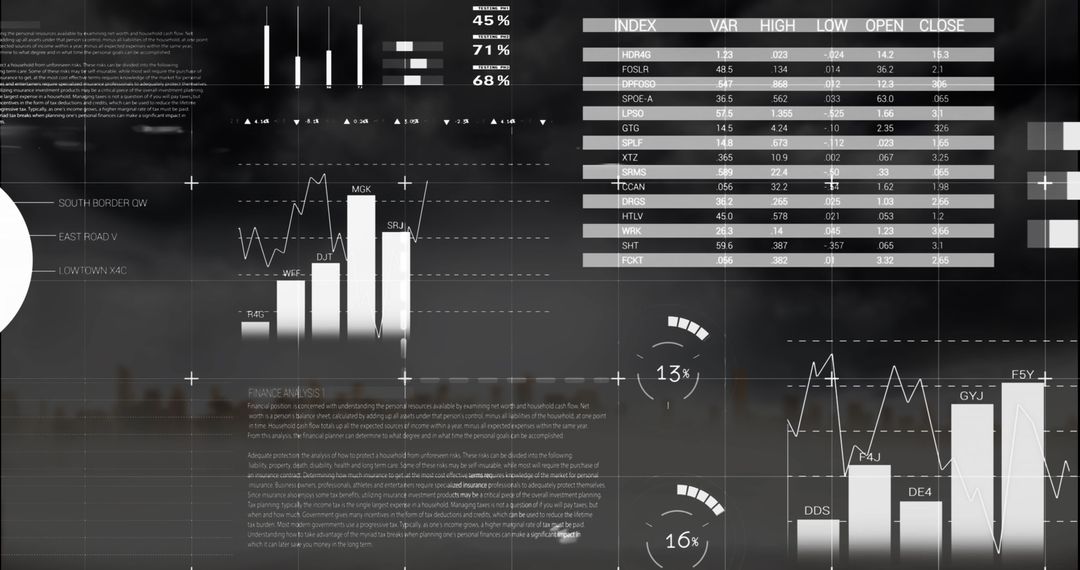
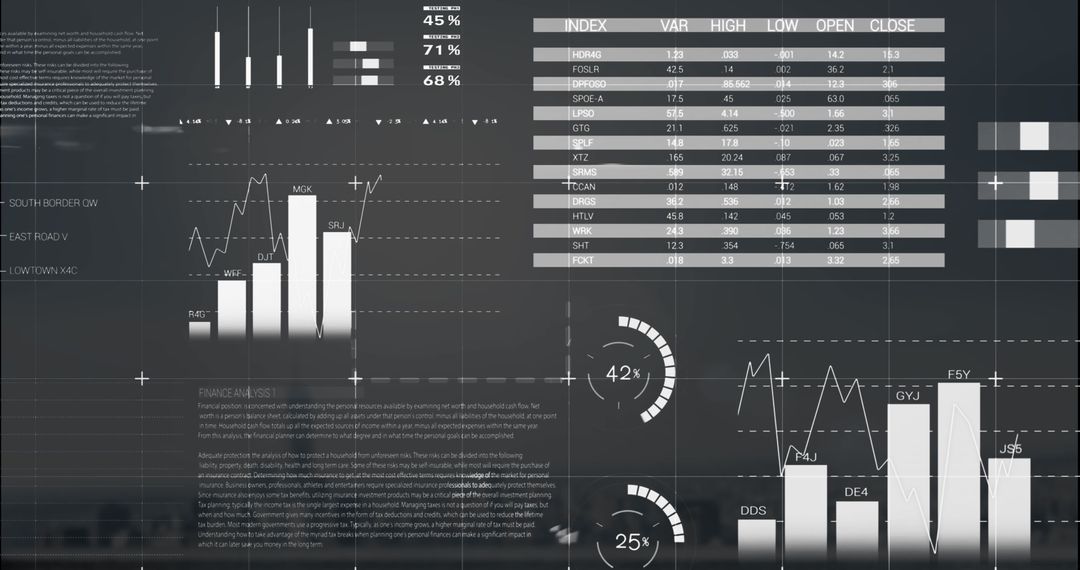
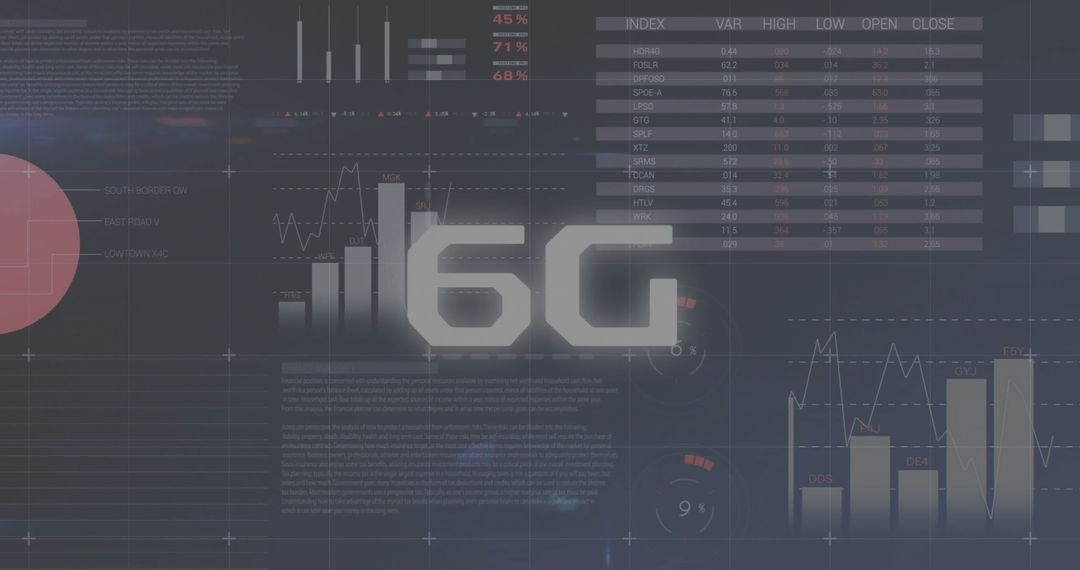
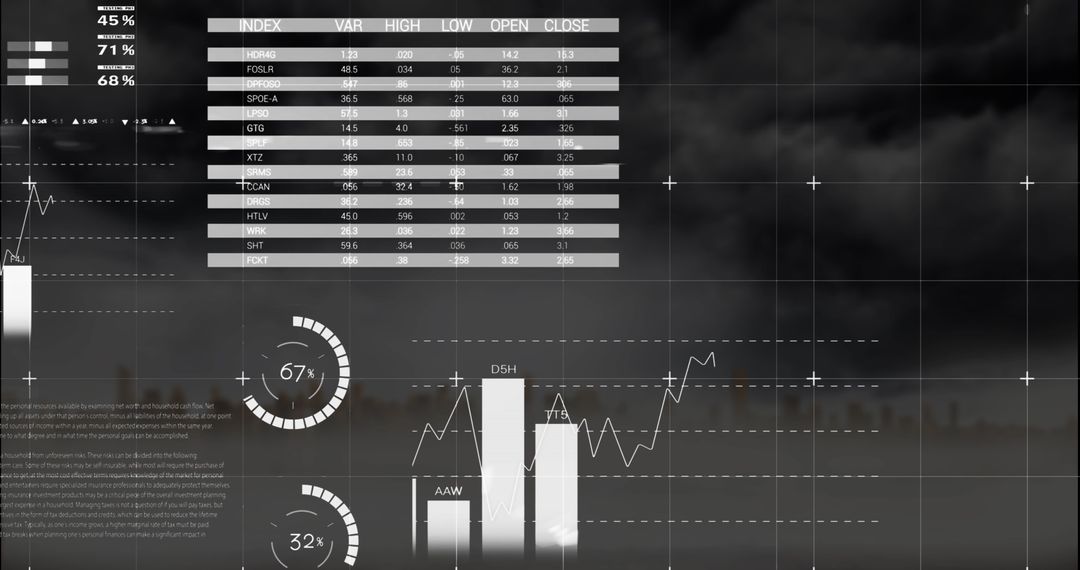
- Digital Interface with Stock Market Graphs and Statistics
Digital Interface with Stock Market Graphs and Statistics Image

Professionally designed collage showcasing animated stock market graphs and statistical information on a dark, futuristic display. Ideal for editorial purposes involving reports on financial markets or digital technology trends. Useful as visual aid in presentations or blogs focusing on data analysis and technological advancements. Suitable for illustrating concepts related to economic forecasts, analytics, and global finance.
Powered by 


4
downloads
downloads
Tags:
More
Credit Photo
If you would like to credit the Photo, here are some ways you can do so
Text Link
photo Link
<span class="text-link">
<span>
<a target="_blank" href=https://pikwizard.com/photo/digital-interface-with-stock-market-graphs-and-statistics/dd2452e712ad8f4e66bf04c9cf7d1875/>PikWizard</a>
</span>
</span>
<span class="image-link">
<span
style="margin: 0 0 20px 0; display: inline-block; vertical-align: middle; width: 100%;"
>
<a
target="_blank"
href="https://pikwizard.com/photo/digital-interface-with-stock-market-graphs-and-statistics/dd2452e712ad8f4e66bf04c9cf7d1875/"
style="text-decoration: none; font-size: 10px; margin: 0;"
>
<img src="https://pikwizard.com/pw/medium/dd2452e712ad8f4e66bf04c9cf7d1875.jpg" style="margin: 0; width: 100%;" alt="" />
<p style="font-size: 12px; margin: 0;">PikWizard</p>
</a>
</span>
</span>
Free (free of charge)
Free for personal and commercial use.
Author: People Creations
Similar Free Stock Images

Premium


Premium


Premium


Premium


Premium


Premium


Premium


Premium


Premium


Premium


Premium


Premium


Premium


Premium


Premium


Premium


Premium


Premium


Premium


Premium


Premium


Premium


Premium


Premium