
- Home >
- Stock Photos >
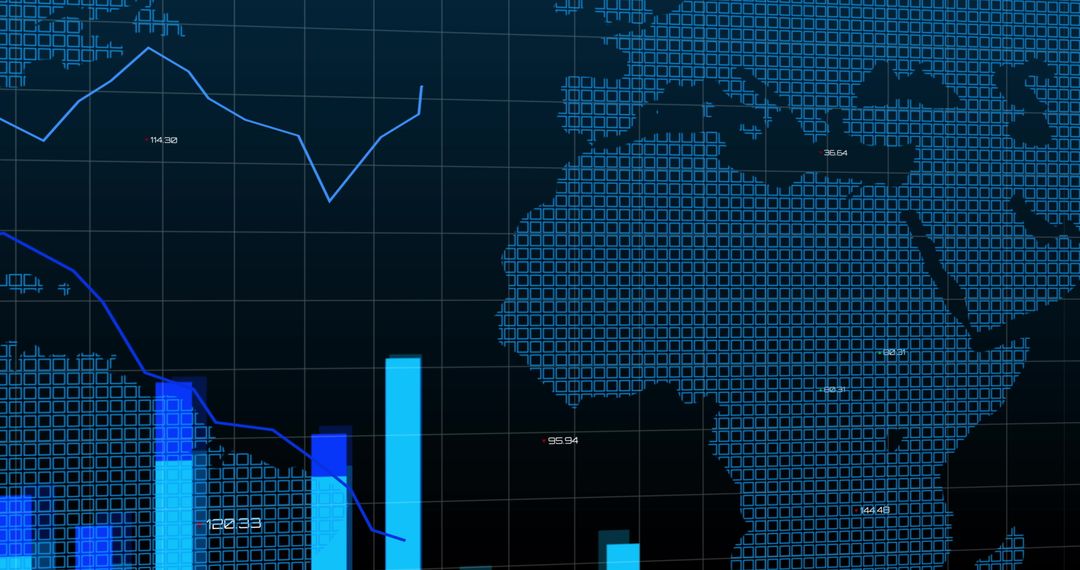
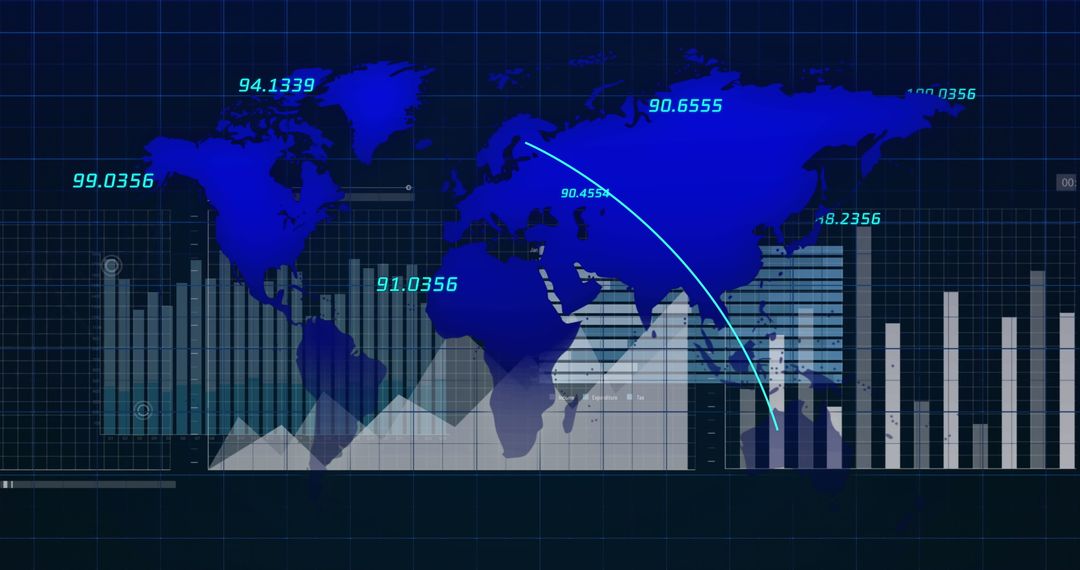
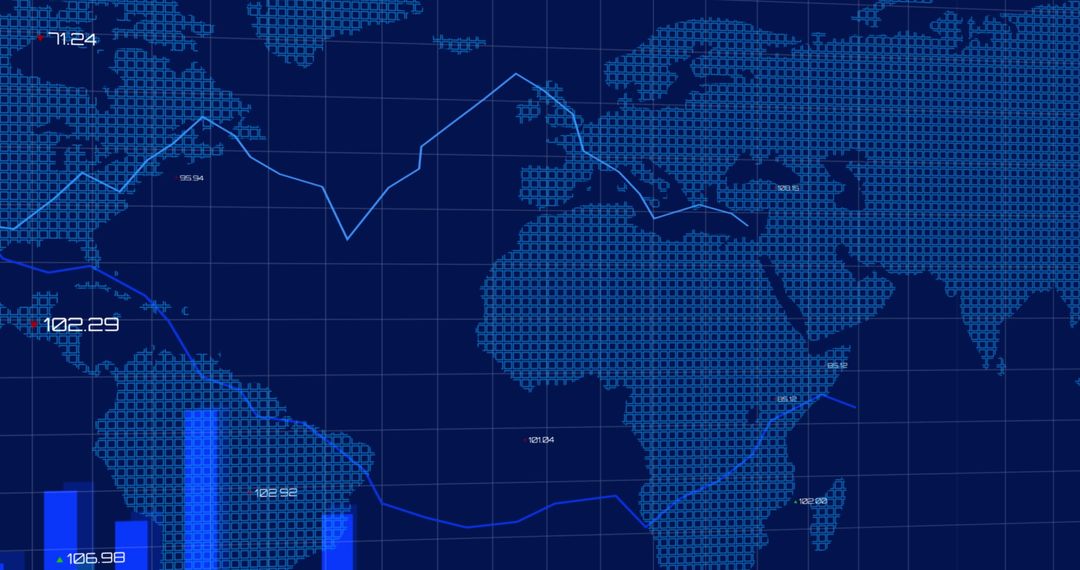
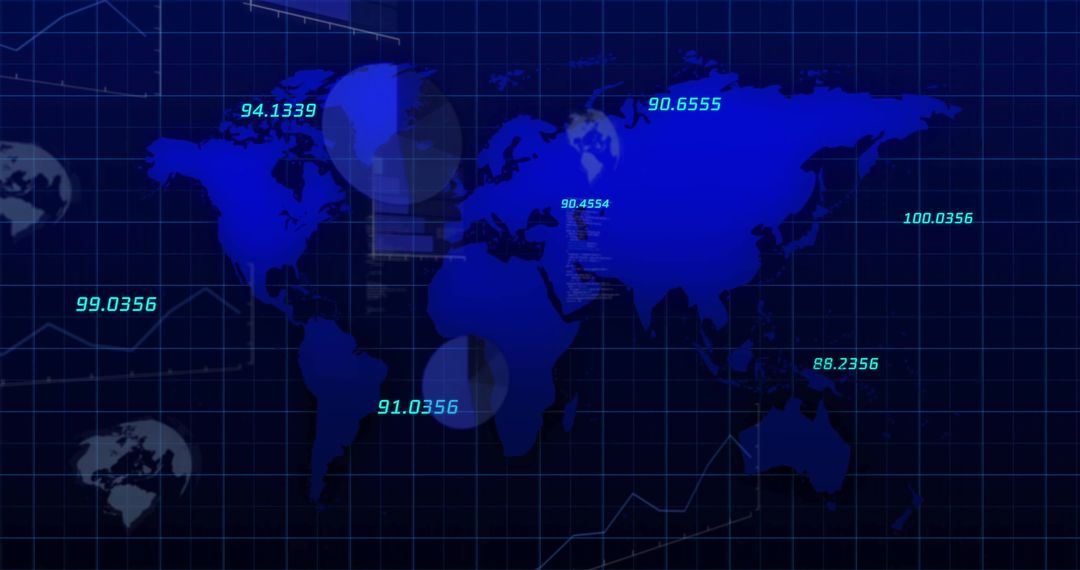
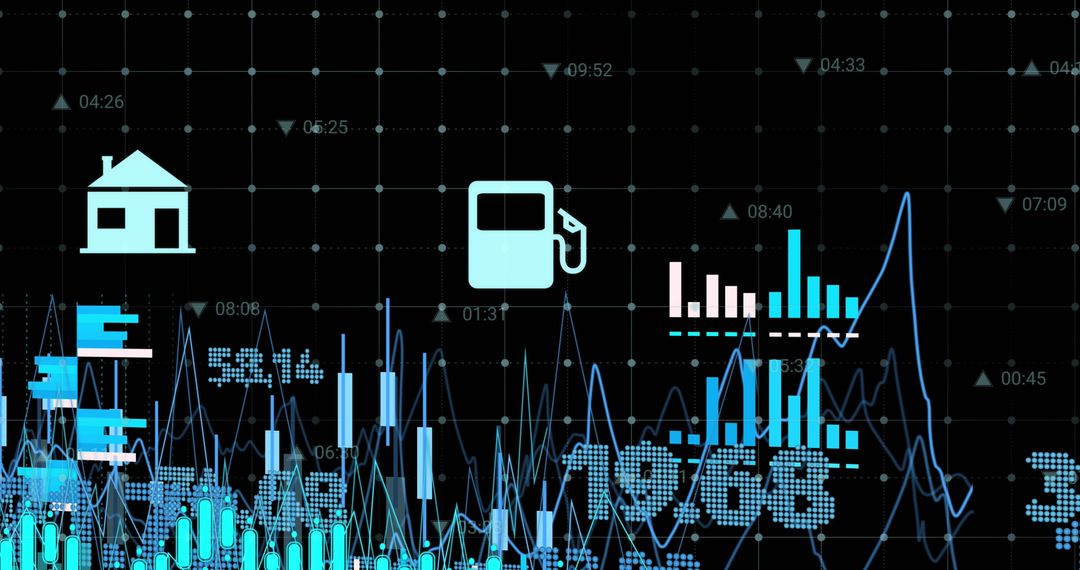
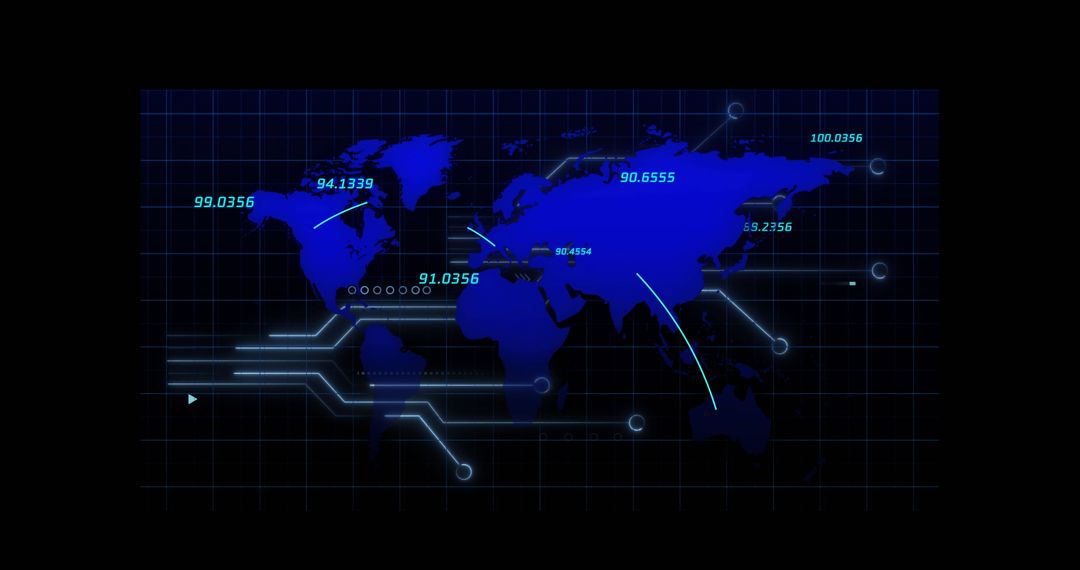
- Digital Interface with World Map and Bar Charts on Dark Dashboard
Digital Interface with World Map and Bar Charts on Dark Dashboard Image

Dynamic digital interface featuring blue bar charts and white line graph overlaying a world map. This detailed representation is ideal for presentations on analytics and data visualization. Suitable for illustrating topics on global business intelligence, technological advancements, or dashboard designs. Enhance your presentations in sectors like finance, tech, and data analysis with this compelling graphic.
Powered by 


0
downloads
downloads
Tags:
More
Credit Photo
If you would like to credit the Photo, here are some ways you can do so
Text Link
photo Link
<span class="text-link">
<span>
<a target="_blank" href=https://pikwizard.com/photo/digital-interface-with-world-map-and-bar-charts-on-dark-dashboard/4d73dabd74466dae4e0c500e826a9cef/>PikWizard</a>
</span>
</span>
<span class="image-link">
<span
style="margin: 0 0 20px 0; display: inline-block; vertical-align: middle; width: 100%;"
>
<a
target="_blank"
href="https://pikwizard.com/photo/digital-interface-with-world-map-and-bar-charts-on-dark-dashboard/4d73dabd74466dae4e0c500e826a9cef/"
style="text-decoration: none; font-size: 10px; margin: 0;"
>
<img src="https://pikwizard.com/pw/medium/4d73dabd74466dae4e0c500e826a9cef.jpg" style="margin: 0; width: 100%;" alt="" />
<p style="font-size: 12px; margin: 0;">PikWizard</p>
</a>
</span>
</span>
Free (free of charge)
Free for personal and commercial use.
Author: Awesome Content
Similar Free Stock Images
Premium


Premium


Premium


Premium


Premium


Premium


Premium


Premium


Premium


Premium


Premium


Premium


Premium


Premium


Premium


Premium


Premium


Premium


Premium


Premium


Premium


Premium


Premium


Premium

