- Home >
- Stock Photos >
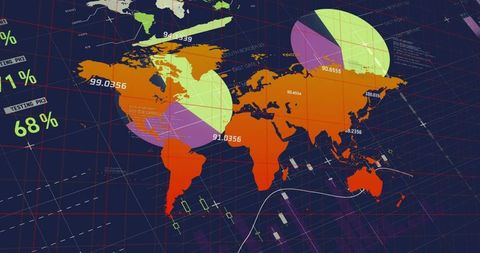
- Digital Interface with World Map and Data Analytics Visualization
Digital Interface with World Map and Data Analytics Visualization Image

Illustrates modern digital interface with world map overlay and analytics elements. Visualizes data analytics with bar charts and grids. Utilized in online presentations, data-driven technology blogs, and educational tools emphasizing global analytics.

downloads
Tags:
More
Credit Photo
If you would like to credit the Photo, here are some ways you can do so
Text Link
photo Link
<span class="text-link">
<span>
<a target="_blank" href=https://pikwizard.com/photo/digital-interface-with-world-map-and-data-analytics-visualization/3802cefd7d20d2c74dd6856070f2695a/>PikWizard</a>
</span>
</span>
<span class="image-link">
<span
style="margin: 0 0 20px 0; display: inline-block; vertical-align: middle; width: 100%;"
>
<a
target="_blank"
href="https://pikwizard.com/photo/digital-interface-with-world-map-and-data-analytics-visualization/3802cefd7d20d2c74dd6856070f2695a/"
style="text-decoration: none; font-size: 10px; margin: 0;"
>
<img src="https://pikwizard.com/pw/medium/3802cefd7d20d2c74dd6856070f2695a.jpg" style="margin: 0; width: 100%;" alt="" />
<p style="font-size: 12px; margin: 0;">PikWizard</p>
</a>
</span>
</span>
Free (free of charge)
Free for personal and commercial use.
Author: People Creations