- Home >
- Stock Photos >
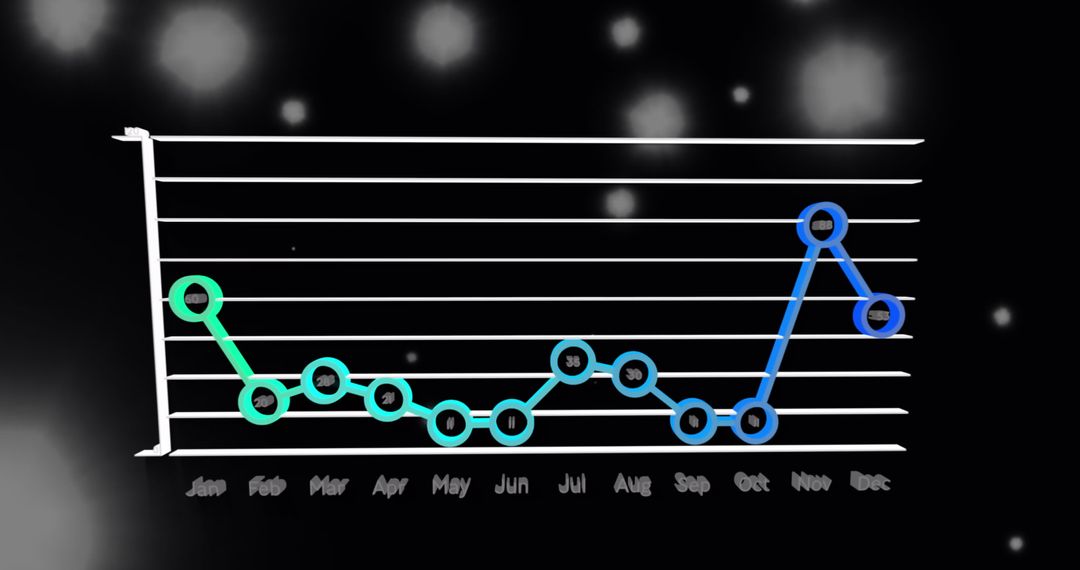
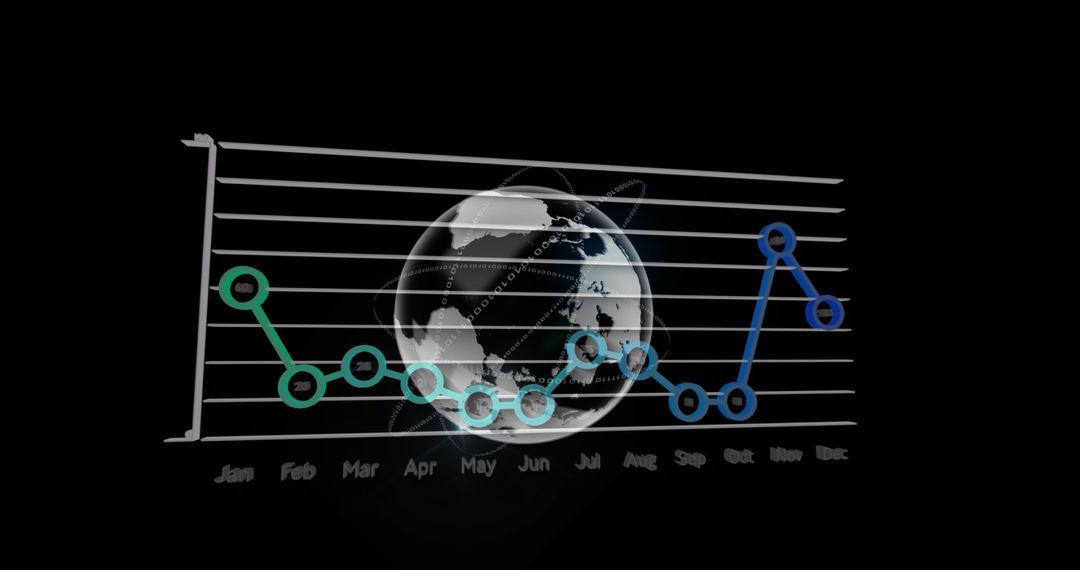
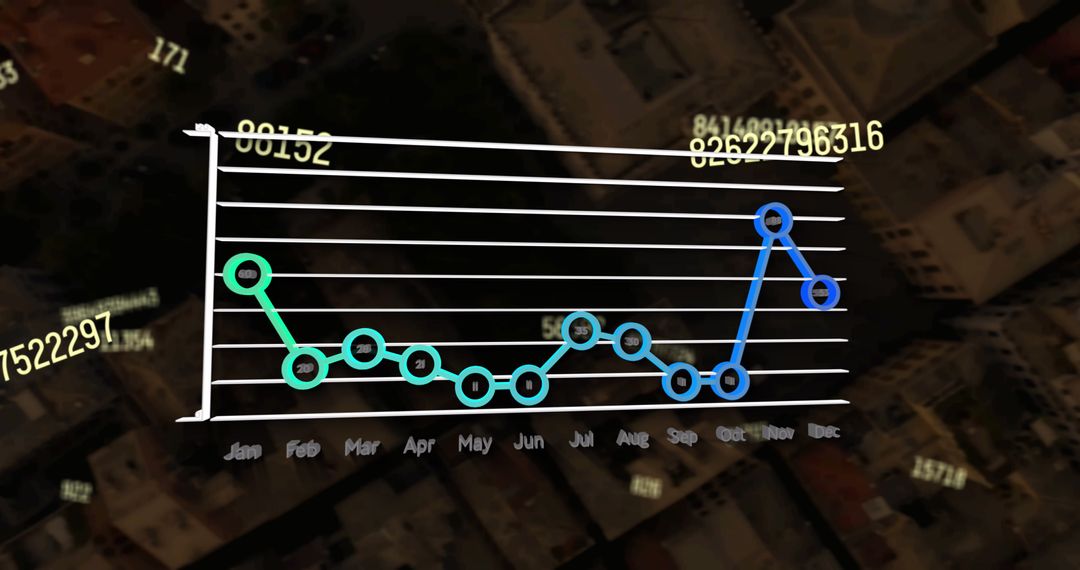
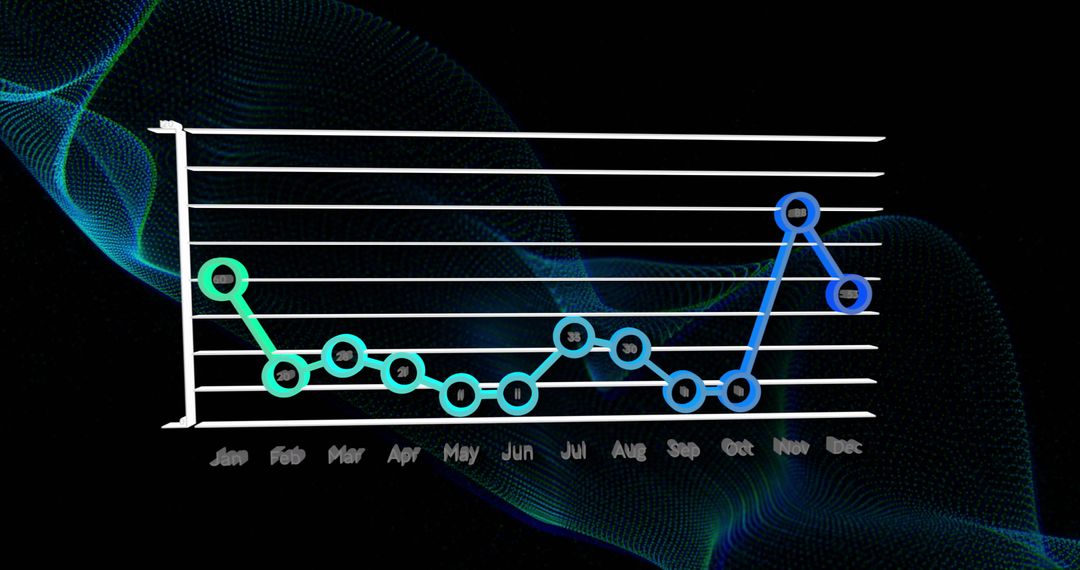
- Digital Line Graph with Months on Blue Background
Digital Line Graph with Months on Blue Background Image

Digital line graph displays data over months on navy background. Useful for illustrating business trends, financial analysis, market statistics, or social research data presentations.
Powered by 


2
downloads
downloads
Tags:
More
Credit Photo
If you would like to credit the Photo, here are some ways you can do so
Text Link
photo Link
<span class="text-link">
<span>
<a target="_blank" href=https://pikwizard.com/photo/digital-line-graph-with-months-on-blue-background/0d437a86beebbdfb1cf5f7507166e3dd/>PikWizard</a>
</span>
</span>
<span class="image-link">
<span
style="margin: 0 0 20px 0; display: inline-block; vertical-align: middle; width: 100%;"
>
<a
target="_blank"
href="https://pikwizard.com/photo/digital-line-graph-with-months-on-blue-background/0d437a86beebbdfb1cf5f7507166e3dd/"
style="text-decoration: none; font-size: 10px; margin: 0;"
>
<img src="https://pikwizard.com/pw/medium/0d437a86beebbdfb1cf5f7507166e3dd.jpg" style="margin: 0; width: 100%;" alt="" />
<p style="font-size: 12px; margin: 0;">PikWizard</p>
</a>
</span>
</span>
Free (free of charge)
Free for personal and commercial use.
Author: People Creations
Similar Free Stock Images