
- Home >
- Free Stock Photos & Images >
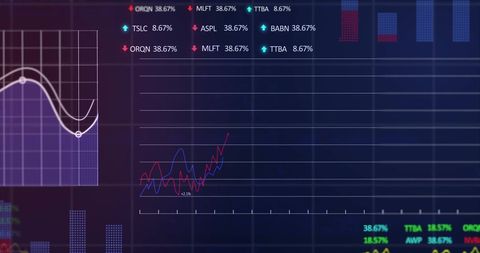
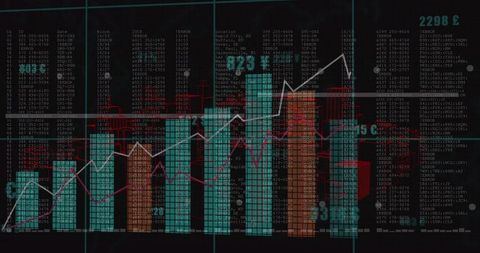
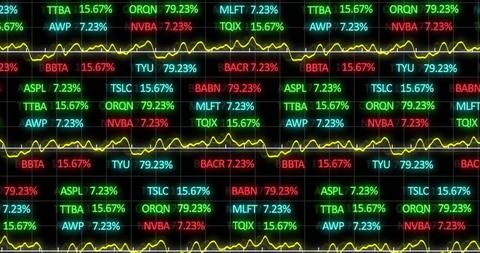
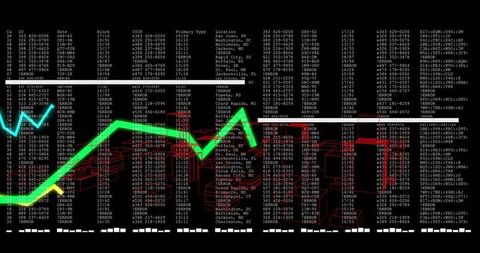
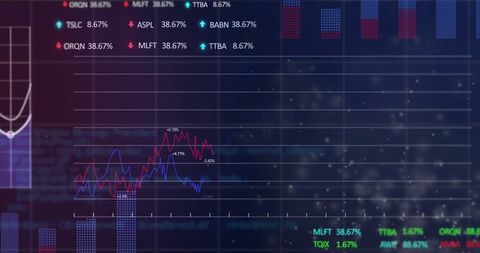
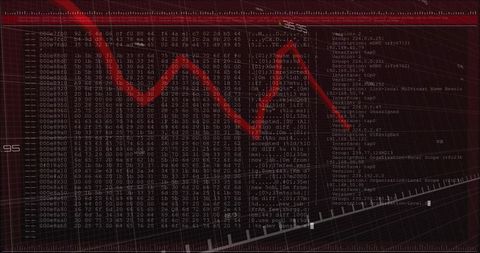
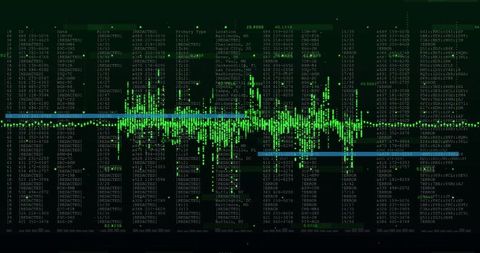
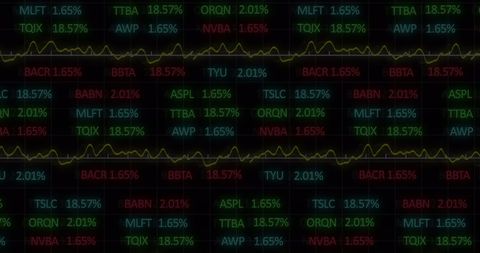
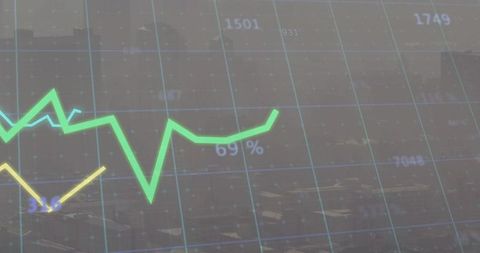
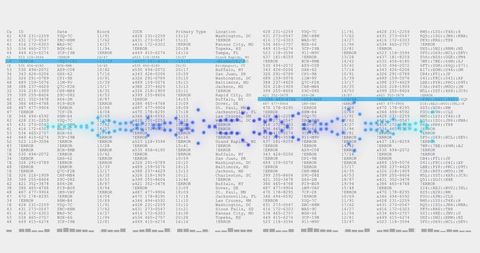
- Digital Log Analytics with Overlaid Line Charts
Digital Log Analytics with Overlaid Line Charts Free Stock Image

Digital screens display detailed logs with midst analytics showing an overlay of red and teal lines representing data trends. Suitable for illustrating concepts in data analysis, business analytics overview, or cybersecurity monitoring. Perfect for use in professional reports or articles focused on technology and data visualization methodologies.
Powered by  - Get 15% off with code: PIKWIZARD15


downloads
Tags:
More
Credit Photo
If you would like to credit the Photo, here are some ways you can do so
Text Link
photo Link
<span class="text-link">
<span>
<a target="_blank" href=https://pikwizard.com/photo/digital-log-analytics-with-overlaid-line-charts/e51994b5927598f5113cfbc8ccc10fbe/>PikWizard</a>
</span>
</span>
<span class="image-link">
<span
style="margin: 0 0 20px 0; display: inline-block; vertical-align: middle; width: 100%;"
>
<a
target="_blank"
href="https://pikwizard.com/photo/digital-log-analytics-with-overlaid-line-charts/e51994b5927598f5113cfbc8ccc10fbe/"
style="text-decoration: none; font-size: 10px; margin: 0;"
>
<img src="https://thumbs.wbm.im/pw/medium/e51994b5927598f5113cfbc8ccc10fbe.jpg" style="margin: 0; width: 100%;" alt="Digital Log Analytics with Overlaid Line Charts" />
<p style="font-size: 12px; margin: 0;">PikWizard</p>
</a>
</span>
</span>
Free (free of charge)
Free for personal and commercial use.
Author: Creative Art
Similar Free Stock Images

Premium


Premium


Premium


Premium


Premium


Premium


Premium


Premium


Premium


Premium


Premium


Premium


Premium


Premium


Premium


Premium


Premium


Premium


Premium

Premium


Premium


Premium


Premium


Premium


Premium

Explore More Free Stock Images