
- Home >
- Stock Photos >
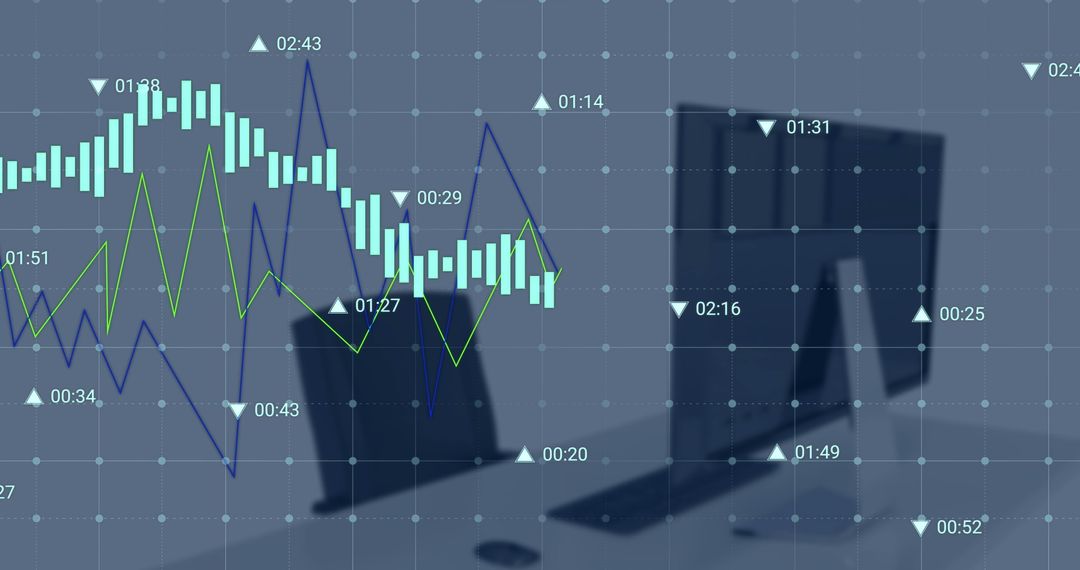
- Digital Market Analysis with Rising and Falling Graphs
Digital Market Analysis with Rising and Falling Graphs Image

This visual showcases the dynamic nature of digital stock market movements. With a backdrop highlighting graphs and data elements, it conveys insights into financial trends and economic forecasts. Useful in presentations about economy, financial analyses, market volatility, or investment planning, it serves as an illustrative tool for reports or articles focusing on current financial affairs.
Powered by  - Get 15% off with code: PIKWIZARD15


2
downloads
downloads
Tags:
More
Credit Photo
If you would like to credit the Photo, here are some ways you can do so
Text Link
photo Link
<span class="text-link">
<span>
<a target="_blank" href=https://pikwizard.com/photo/digital-market-analysis-with-rising-and-falling-graphs/00c889b552b6facbea02a03eea318743/>PikWizard</a>
</span>
</span>
<span class="image-link">
<span
style="margin: 0 0 20px 0; display: inline-block; vertical-align: middle; width: 100%;"
>
<a
target="_blank"
href="https://pikwizard.com/photo/digital-market-analysis-with-rising-and-falling-graphs/00c889b552b6facbea02a03eea318743/"
style="text-decoration: none; font-size: 10px; margin: 0;"
>
<img src="https://pikwizard.com/pw/medium/00c889b552b6facbea02a03eea318743.jpg" style="margin: 0; width: 100%;" alt="" />
<p style="font-size: 12px; margin: 0;">PikWizard</p>
</a>
</span>
</span>
Free (free of charge)
Free for personal and commercial use.
Author: Awesome Content
Similar Free Stock Images

Premium


Premium


Premium


Premium


Premium


Premium


Premium


Premium


Premium


Premium


Premium


Premium


Premium


Premium


Premium


Premium


Premium


Premium


Premium


Premium


Premium


Premium


Premium


Premium

