- Home >
- Stock Photos >
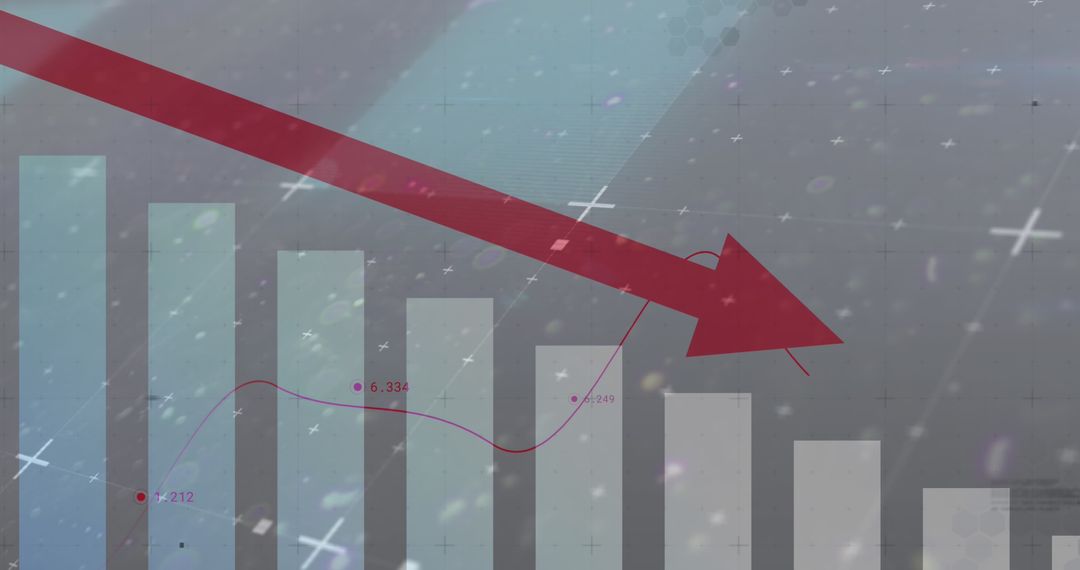
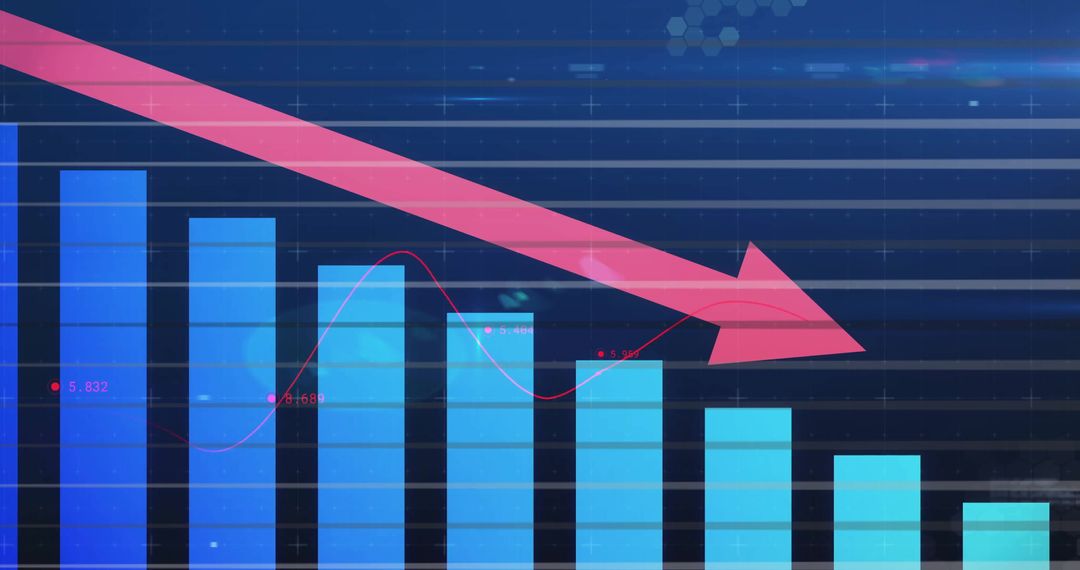
- Digital Marketing Trends with Declining Graph and Data Visualizations
Digital Marketing Trends with Declining Graph and Data Visualizations Image

Illustrates digital trends using a declining graph and dynamic data visualizations. Useful for articles on economic decline, financial analytics, or market research reports. Ideal for business presentations showcasing trends, data analysis, or corporate training materials explaining economic forecasts.
Powered by 


2
downloads
downloads
Tags:
More
Credit Photo
If you would like to credit the Photo, here are some ways you can do so
Text Link
photo Link
<span class="text-link">
<span>
<a target="_blank" href=https://pikwizard.com/photo/digital-marketing-trends-with-declining-graph-and-data-visualizations/333a9e3a736cf486e7e495587596004a/>PikWizard</a>
</span>
</span>
<span class="image-link">
<span
style="margin: 0 0 20px 0; display: inline-block; vertical-align: middle; width: 100%;"
>
<a
target="_blank"
href="https://pikwizard.com/photo/digital-marketing-trends-with-declining-graph-and-data-visualizations/333a9e3a736cf486e7e495587596004a/"
style="text-decoration: none; font-size: 10px; margin: 0;"
>
<img src="https://pikwizard.com/pw/medium/333a9e3a736cf486e7e495587596004a.jpg" style="margin: 0; width: 100%;" alt="" />
<p style="font-size: 12px; margin: 0;">PikWizard</p>
</a>
</span>
</span>
Free (free of charge)
Free for personal and commercial use.
Author: Awesome Content
Similar Free Stock Images

Premium


Premium


Premium


Premium


Premium


Premium


Premium


Premium


Premium


Premium


Premium


Premium


Premium


Premium


Premium


Premium


Premium


Premium


Premium


Premium


Premium


Premium


Premium


Premium