- Home >
- Stock Photos >
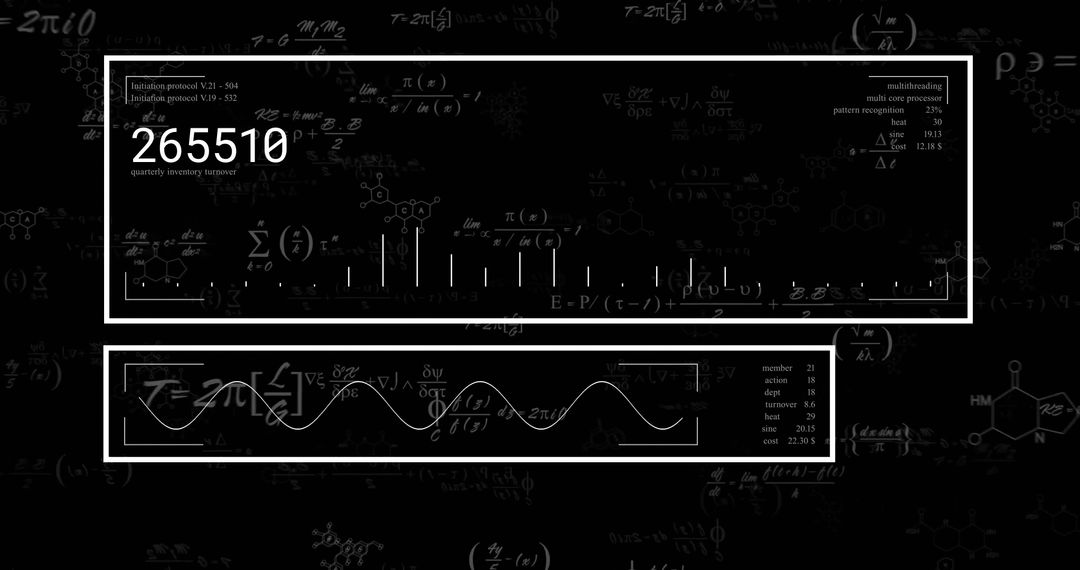
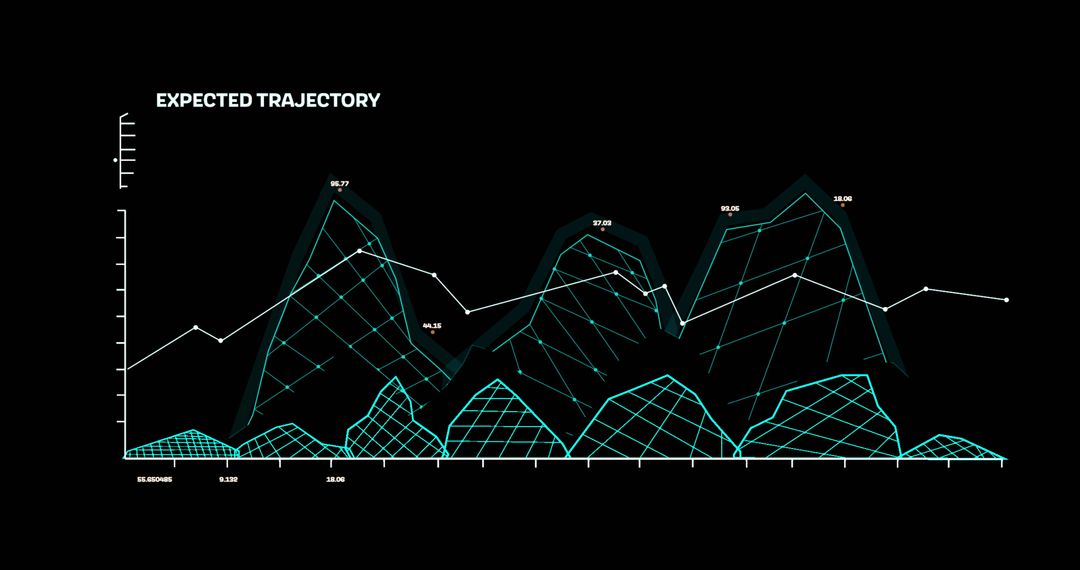
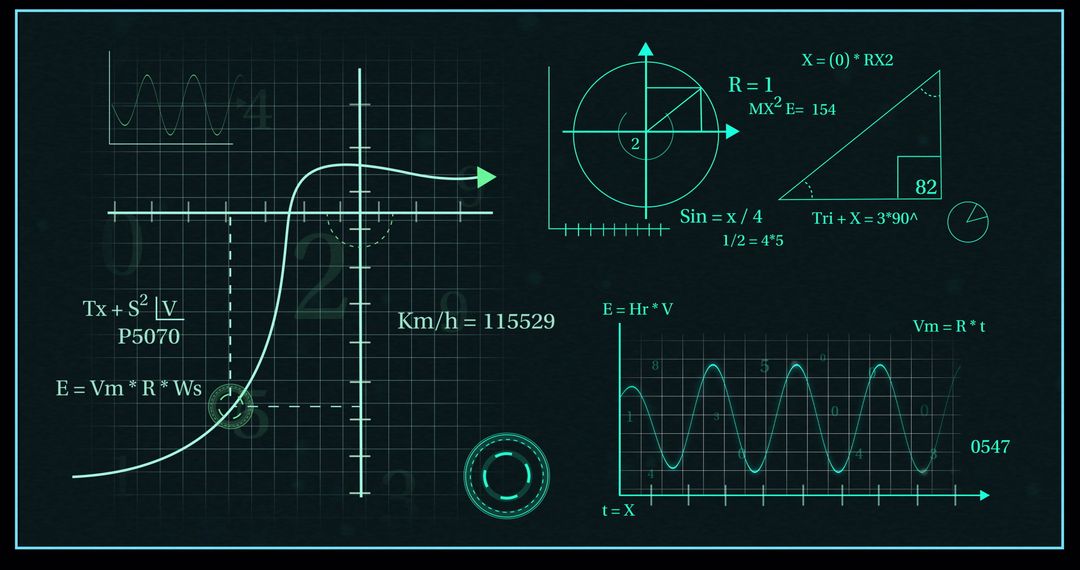
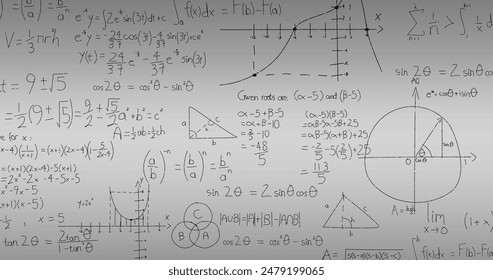
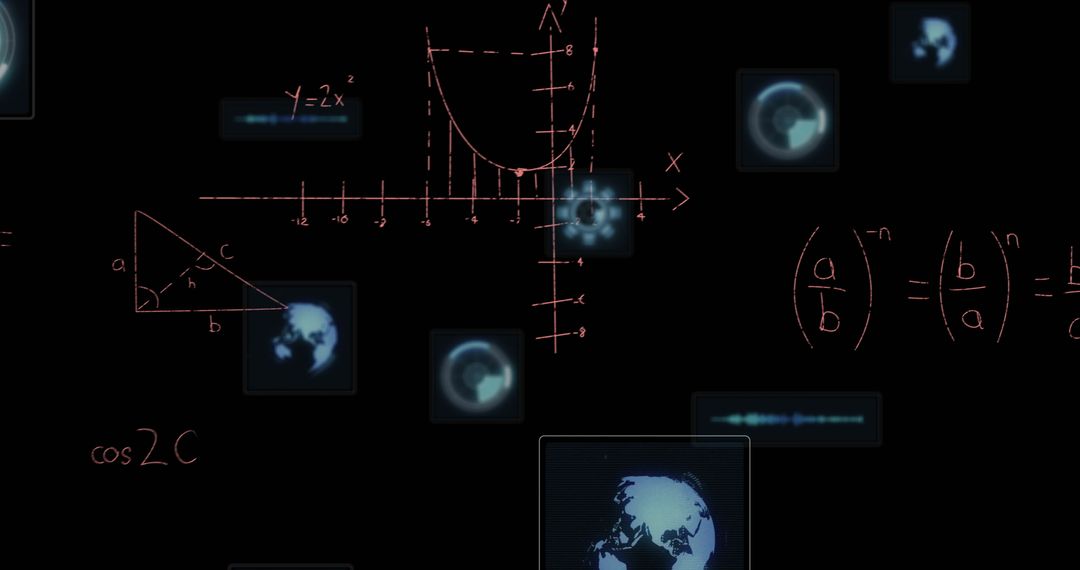
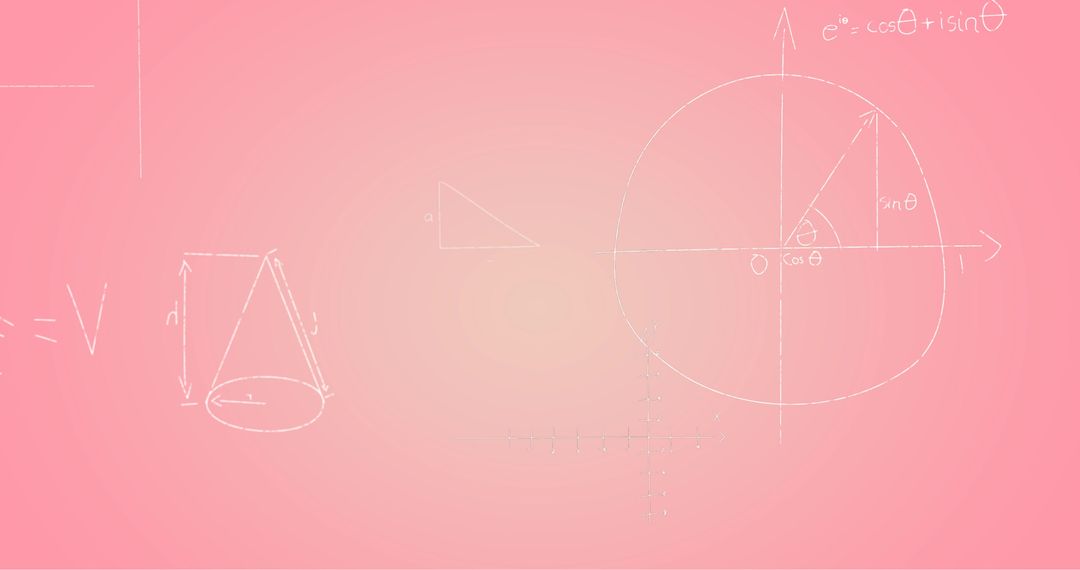
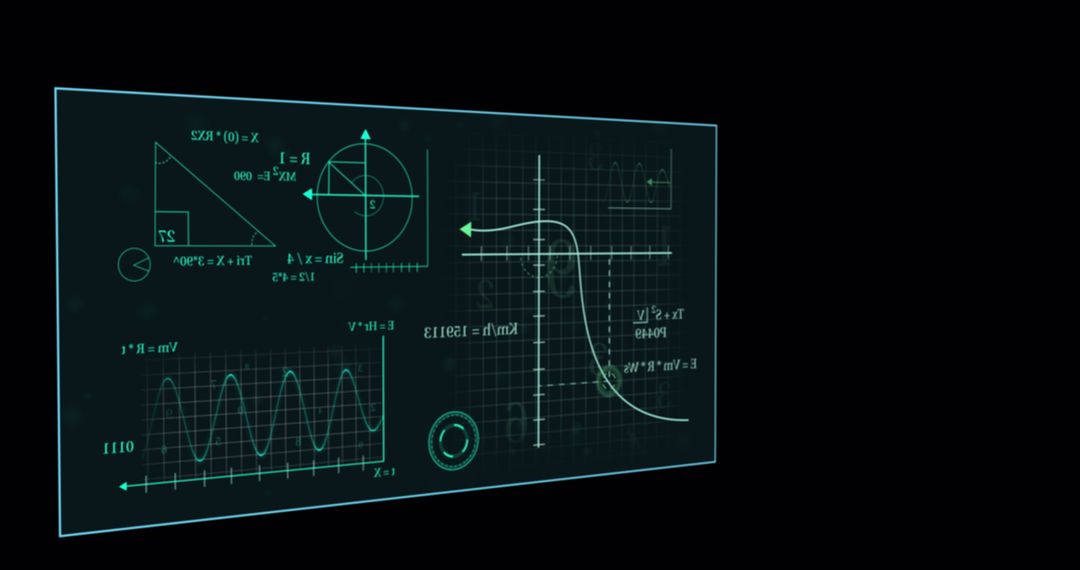
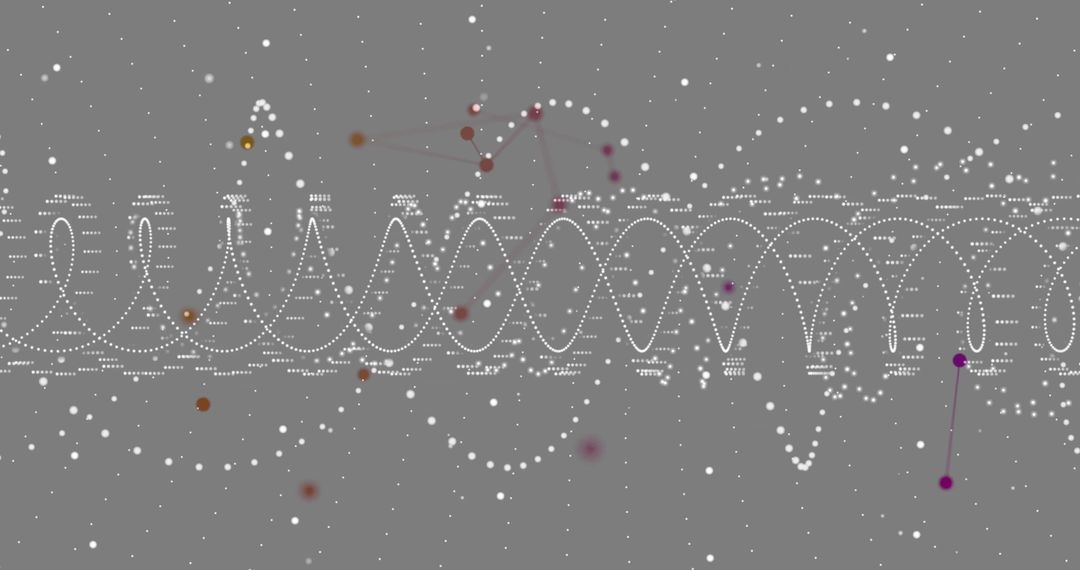
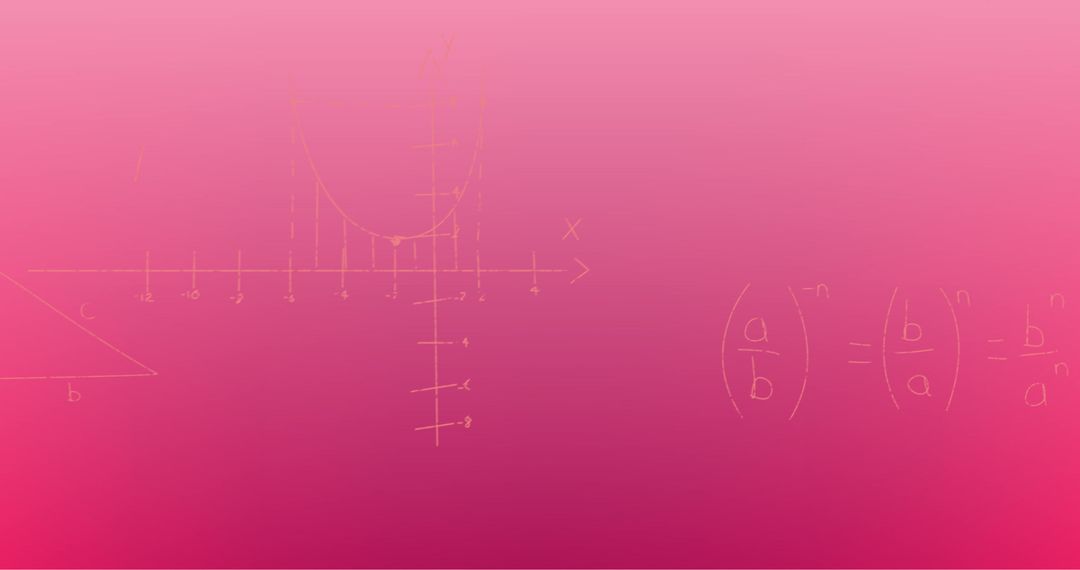
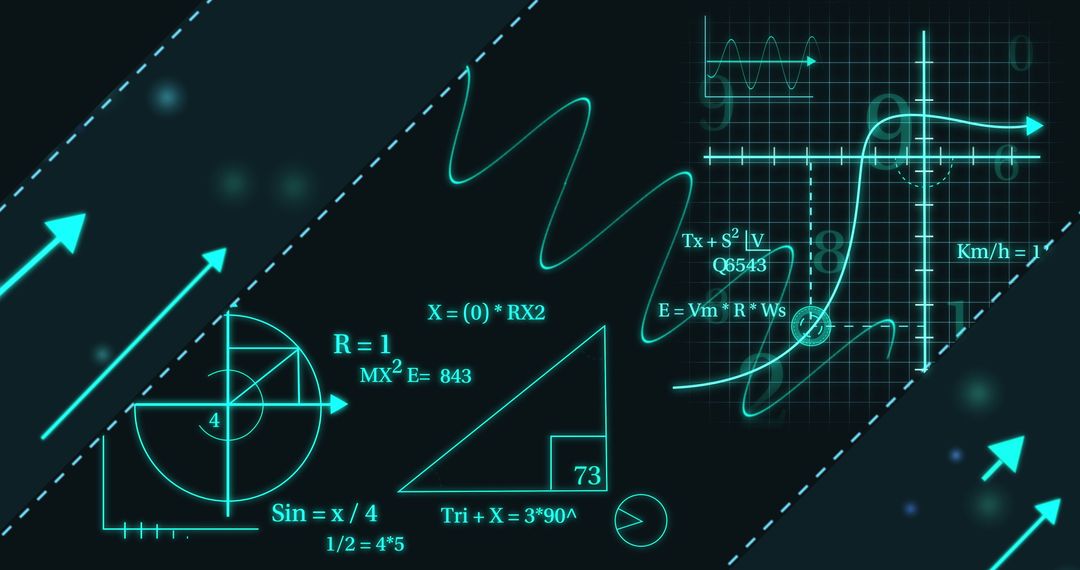
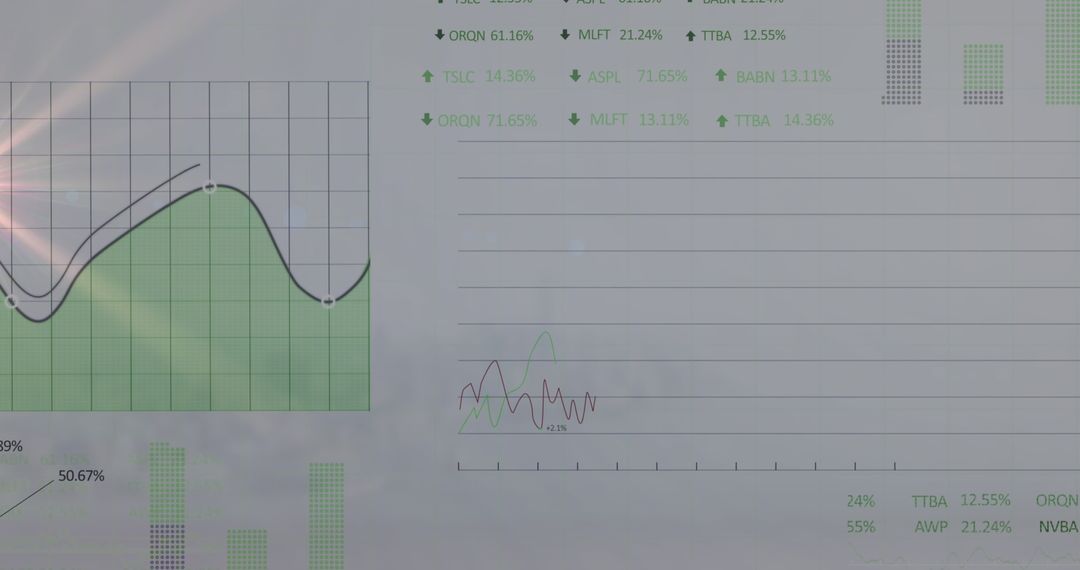
- Digital Mathematics Writing with Scientific Graphs on Grey
Digital Mathematics Writing with Scientific Graphs on Grey Image

Perfect for educational content, online courses, and scientific articles, this image illustrates key mathematical concepts with clarity. It is ideal for creating engaging learning materials or decorative items for classrooms or educational institutions.
Powered by  - Get 15% off with code: PIKWIZARD15


2
downloads
downloads
Tags:
More
Credit Photo
If you would like to credit the Photo, here are some ways you can do so
Text Link
photo Link
<span class="text-link">
<span>
<a target="_blank" href=https://pikwizard.com/photo/digital-mathematics-writing-with-scientific-graphs-on-grey/b726c5a4e3769e6935e046d1293bed8b/>PikWizard</a>
</span>
</span>
<span class="image-link">
<span
style="margin: 0 0 20px 0; display: inline-block; vertical-align: middle; width: 100%;"
>
<a
target="_blank"
href="https://pikwizard.com/photo/digital-mathematics-writing-with-scientific-graphs-on-grey/b726c5a4e3769e6935e046d1293bed8b/"
style="text-decoration: none; font-size: 10px; margin: 0;"
>
<img src="https://pikwizard.com/pw/medium/b726c5a4e3769e6935e046d1293bed8b.jpg" style="margin: 0; width: 100%;" alt="" />
<p style="font-size: 12px; margin: 0;">PikWizard</p>
</a>
</span>
</span>
Free (free of charge)
Free for personal and commercial use.
Author: People Creations
Similar Free Stock Images

Premium

Premium


Premium


Premium


Premium


Premium


Premium

Premium


Premium


Premium


Premium


Premium


Premium


Premium


Premium


Premium


Premium


Premium


Premium


Premium


Premium


Premium


Premium


Premium