- Home >
- Stock Photos >
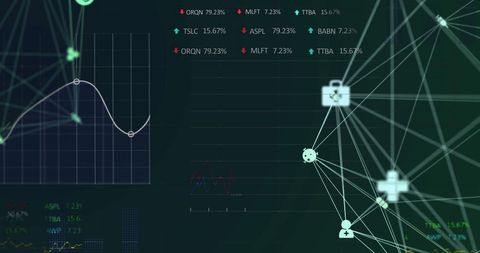
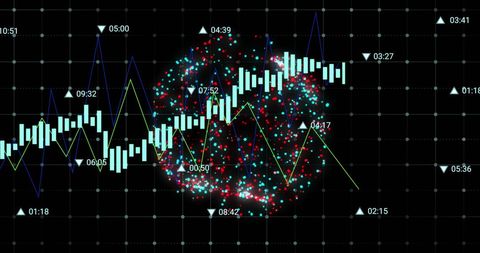
- Digital Network and Data Processing Concept with Graph
Digital Network and Data Processing Concept with Graph Image

Futuristic visuals highlight the intersection of networks and analytics, ideal for illustrating tech, finance, or communication topics. Suitable for use in digital transformation and big data presentations.

downloads
Tags:
More
Credit Photo
If you would like to credit the Photo, here are some ways you can do so
Text Link
photo Link
<span class="text-link">
<span>
<a target="_blank" href=https://pikwizard.com/photo/digital-network-and-data-processing-concept-with-graph/7103f1e52ccca7119c5c080ffcc6e38a/>PikWizard</a>
</span>
</span>
<span class="image-link">
<span
style="margin: 0 0 20px 0; display: inline-block; vertical-align: middle; width: 100%;"
>
<a
target="_blank"
href="https://pikwizard.com/photo/digital-network-and-data-processing-concept-with-graph/7103f1e52ccca7119c5c080ffcc6e38a/"
style="text-decoration: none; font-size: 10px; margin: 0;"
>
<img src="https://pikwizard.com/pw/medium/7103f1e52ccca7119c5c080ffcc6e38a.jpg" style="margin: 0; width: 100%;" alt="" />
<p style="font-size: 12px; margin: 0;">PikWizard</p>
</a>
</span>
</span>
Free (free of charge)
Free for personal and commercial use.
Author: Creative Art