- Home >
- Stock Photos >
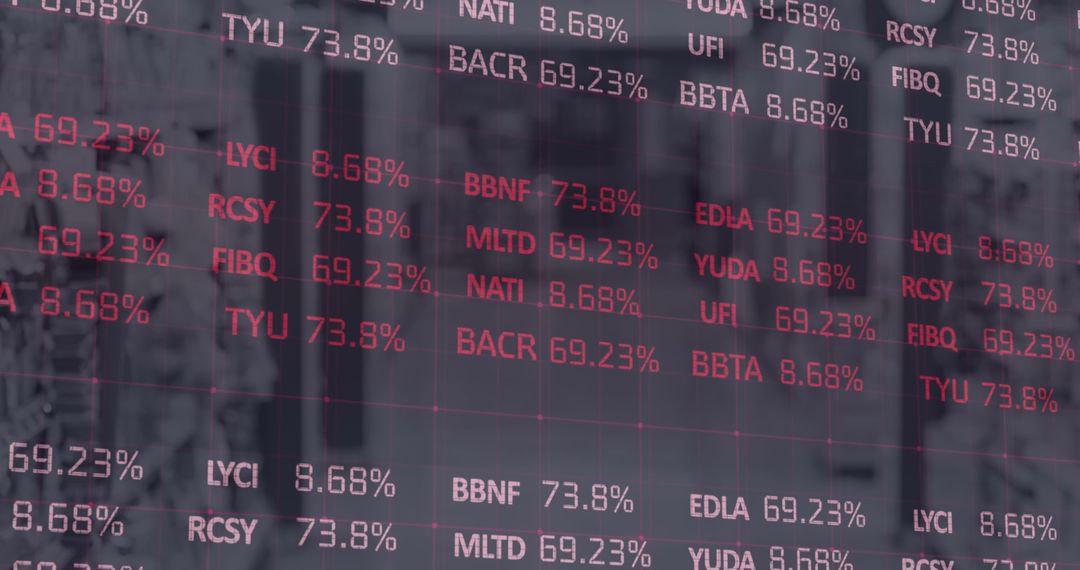
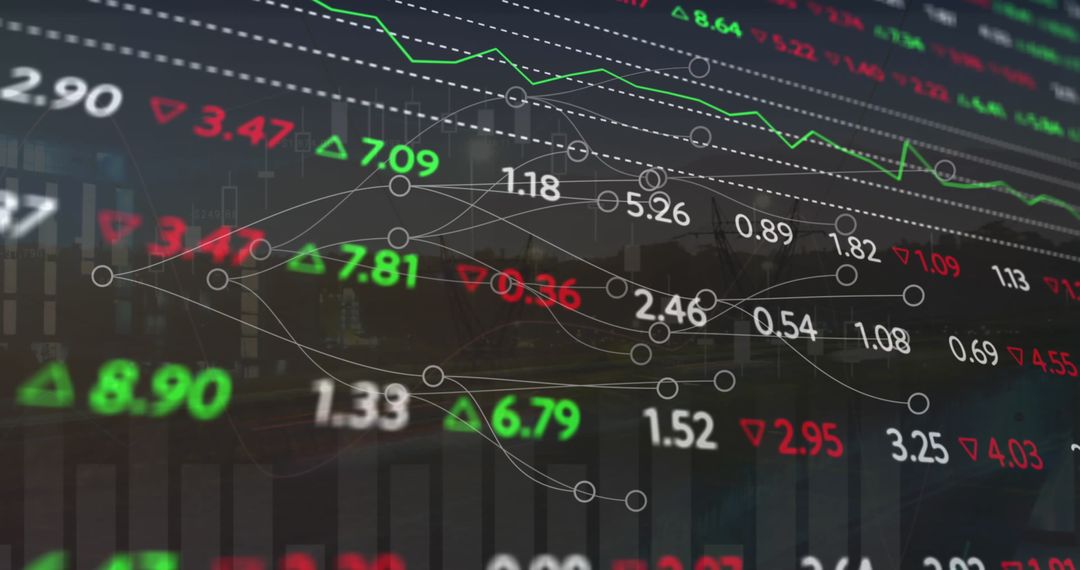
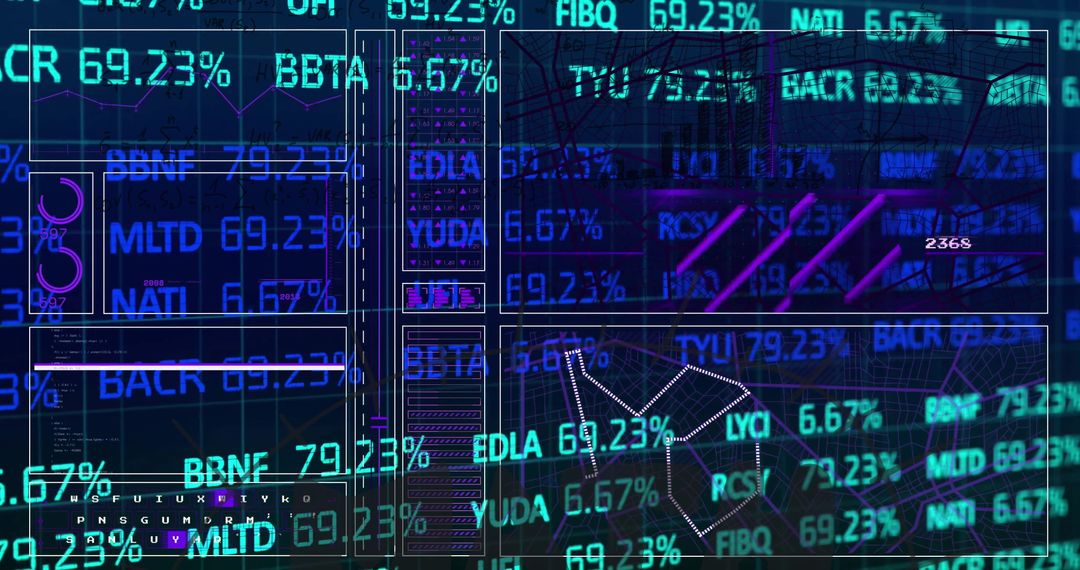
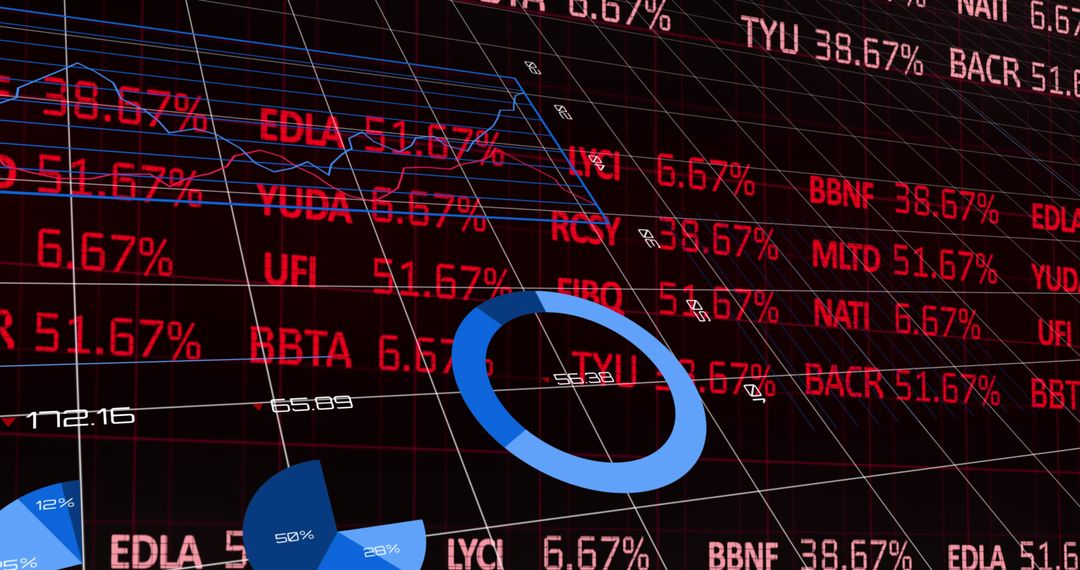
- Digital Network Visualization of Data Metrics in Innovative Dashboard
Digital Network Visualization of Data Metrics in Innovative Dashboard Image

This image captures a digital dashboard featuring network visualizations and real-time data metrics with red ticker codes and percentage values. It showcases innovative technology for illustrating data analytics and communication across networks. This could be used in presentations on technology, articles on data science, or as a visual aid in discussions related to cybersecurity and digital communication.
Powered by  - Get 15% off with code: PIKWIZARD15


0
downloads
downloads
Tags:
More
Credit Photo
If you would like to credit the Photo, here are some ways you can do so
Text Link
photo Link
<span class="text-link">
<span>
<a target="_blank" href=https://pikwizard.com/photo/digital-network-visualization-of-data-metrics-in-innovative-dashboard/c0469d221c4c66a50e4c39f89836de3d/>PikWizard</a>
</span>
</span>
<span class="image-link">
<span
style="margin: 0 0 20px 0; display: inline-block; vertical-align: middle; width: 100%;"
>
<a
target="_blank"
href="https://pikwizard.com/photo/digital-network-visualization-of-data-metrics-in-innovative-dashboard/c0469d221c4c66a50e4c39f89836de3d/"
style="text-decoration: none; font-size: 10px; margin: 0;"
>
<img src="https://pikwizard.com/pw/medium/c0469d221c4c66a50e4c39f89836de3d.jpg" style="margin: 0; width: 100%;" alt="" />
<p style="font-size: 12px; margin: 0;">PikWizard</p>
</a>
</span>
</span>
Free (free of charge)
Free for personal and commercial use.
Author: Authentic Images
Similar Free Stock Images
Premium


Premium


Premium


Premium


Premium


Premium


Premium


Premium


Premium


Premium


Premium


Premium


Premium


Premium


Premium


Premium


Premium


Premium


Premium


Premium


Premium


Premium


Premium


Premium