- Home >
- Stock Photos >
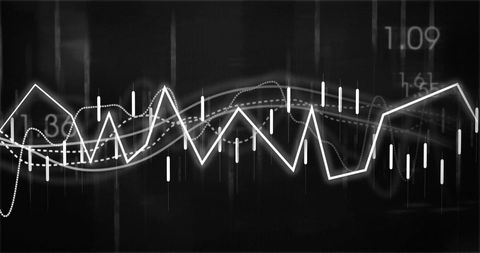
- Digital Oscillation Graph on Dark Background Reflecting Data Trends
Digital Oscillation Graph on Dark Background Reflecting Data Trends Image
This visual shows a digital oscillation graph set against a dark background, representing financial and data trends. Its sleek design conveys technology and business acumen, suitable for illustrating concepts like market analysis, data processing, or the impact of networks in finance. Ideal for business presentations, technology-themed blog posts, and financial reports.

downloads
Tags:
More
Credit Photo
If you would like to credit the Photo, here are some ways you can do so
Text Link
photo Link
<span class="text-link">
<span>
<a target="_blank" href=https://pikwizard.com/photo/digital-oscillation-graph-on-dark-background-reflecting-data-trends/11a4feaab680f19495cdb96e14171172/>PikWizard</a>
</span>
</span>
<span class="image-link">
<span
style="margin: 0 0 20px 0; display: inline-block; vertical-align: middle; width: 100%;"
>
<a
target="_blank"
href="https://pikwizard.com/photo/digital-oscillation-graph-on-dark-background-reflecting-data-trends/11a4feaab680f19495cdb96e14171172/"
style="text-decoration: none; font-size: 10px; margin: 0;"
>
<img src="https://pikwizard.com/pw/medium/11a4feaab680f19495cdb96e14171172.jpg" style="margin: 0; width: 100%;" alt="" />
<p style="font-size: 12px; margin: 0;">PikWizard</p>
</a>
</span>
</span>
Free (free of charge)
Free for personal and commercial use.
Author: People Creations