- Home >
- Stock Photos >
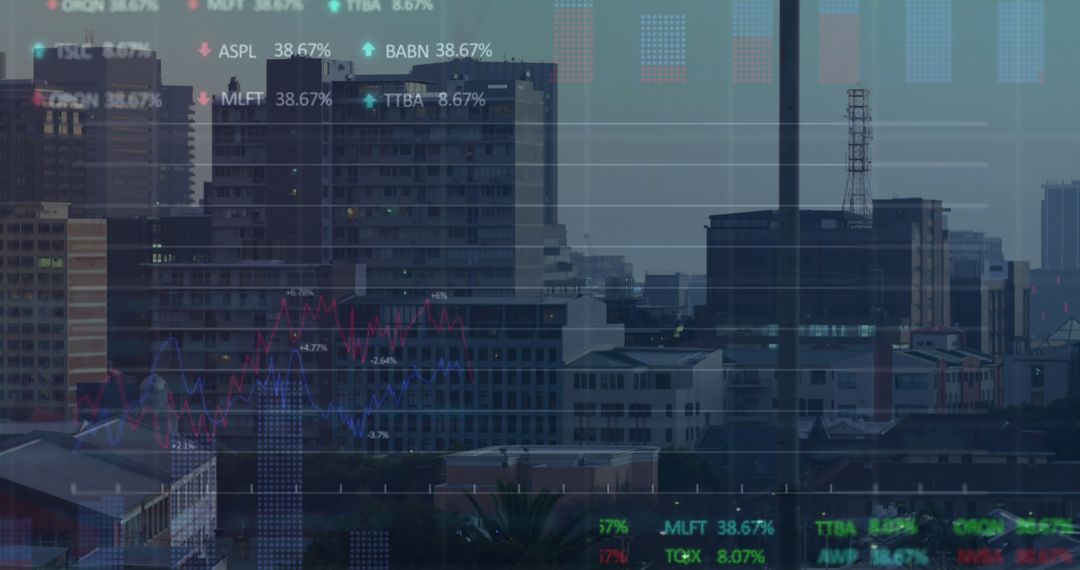
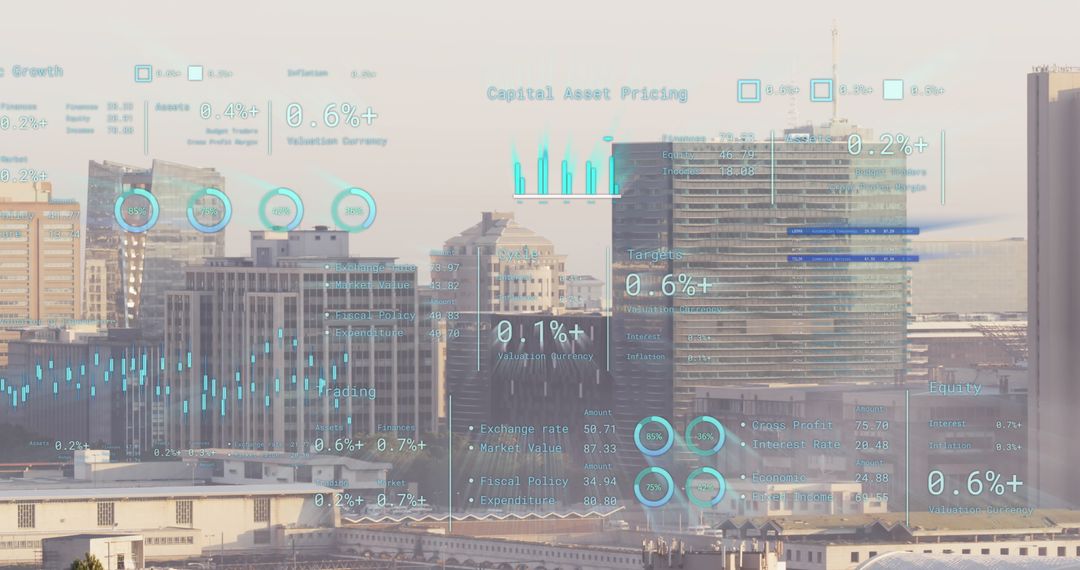
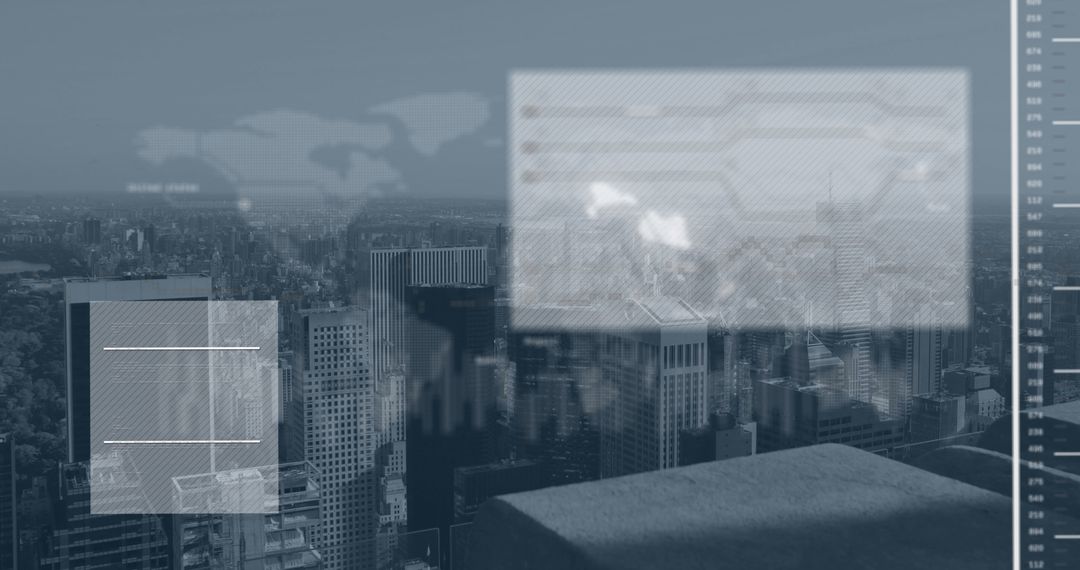
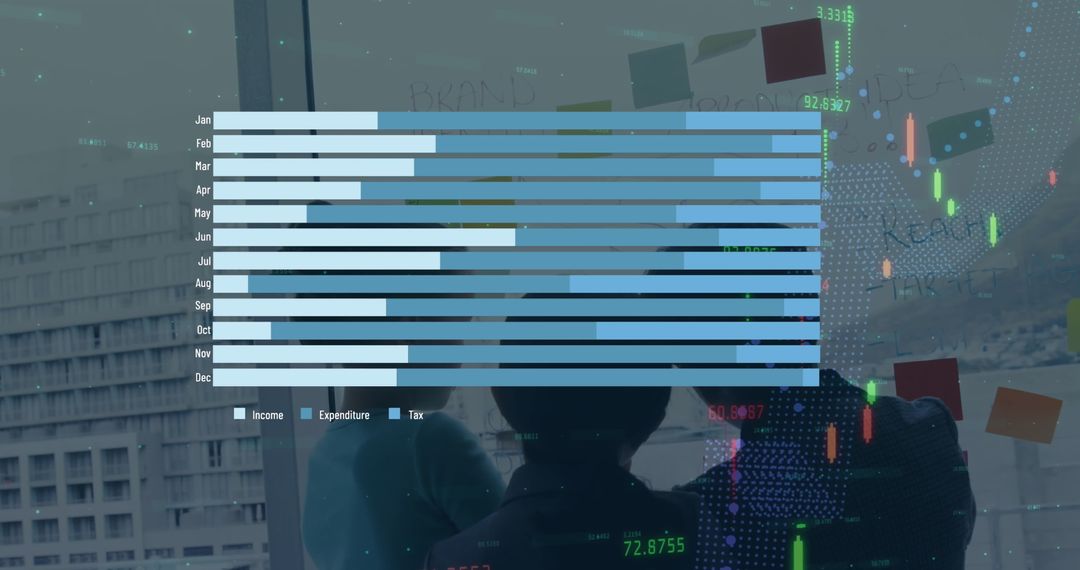
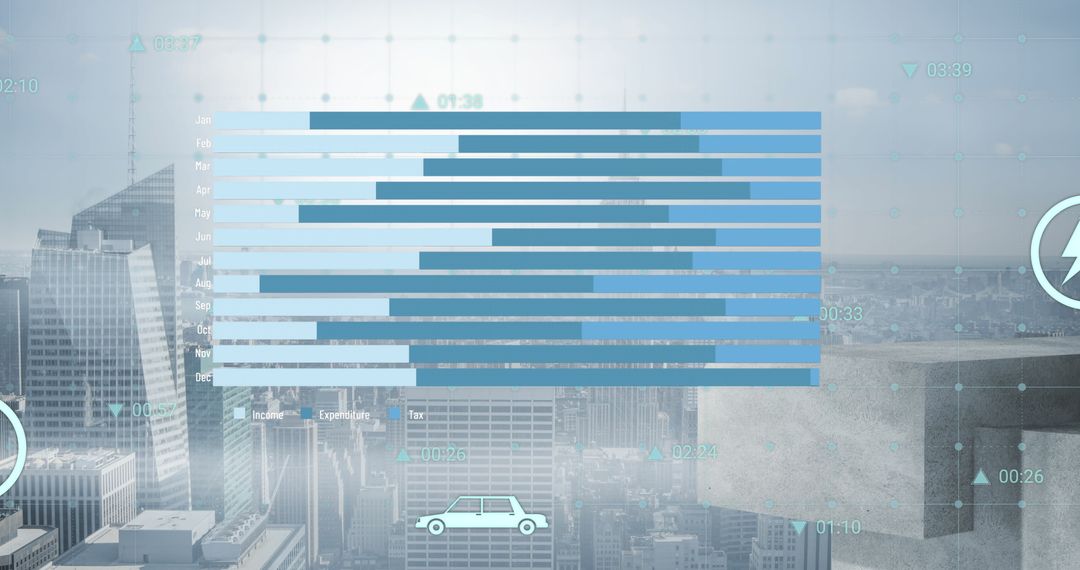
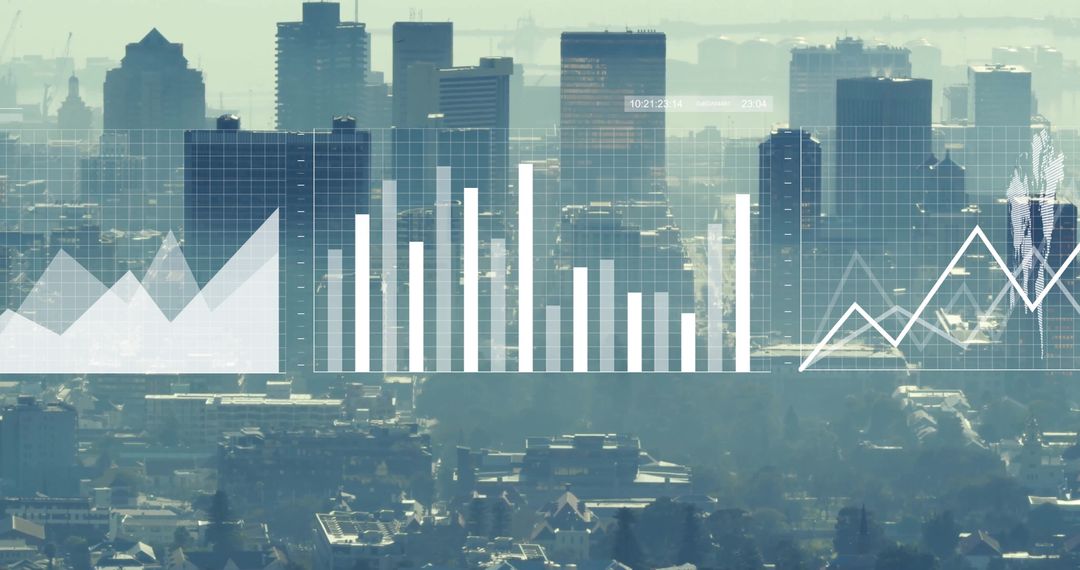
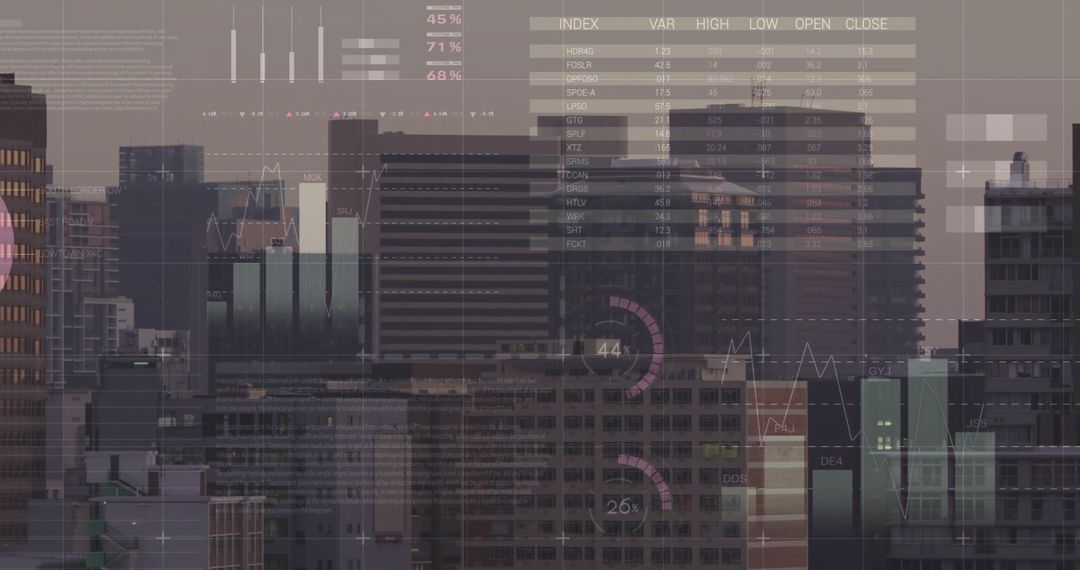
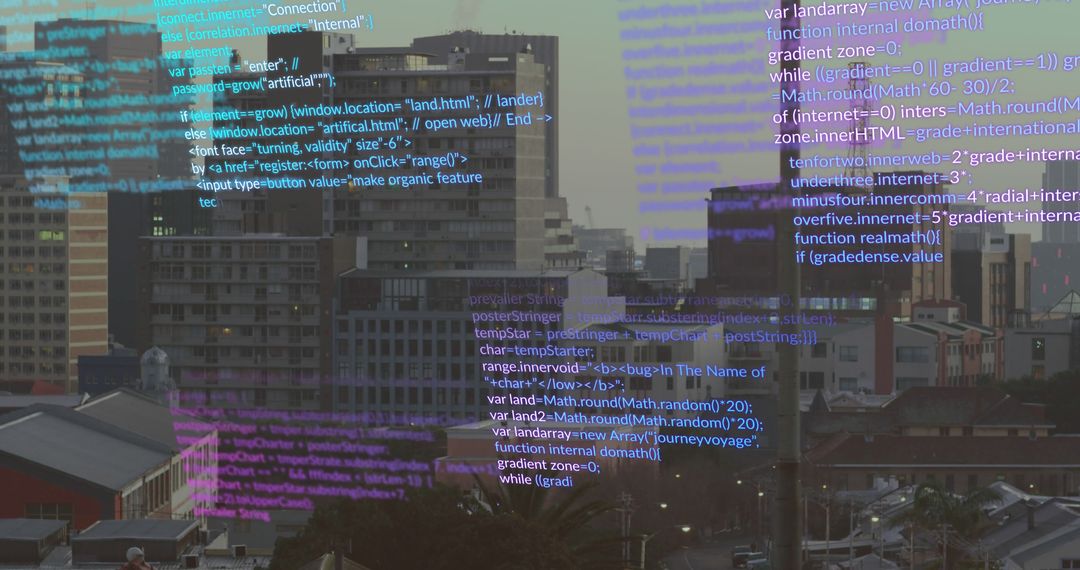
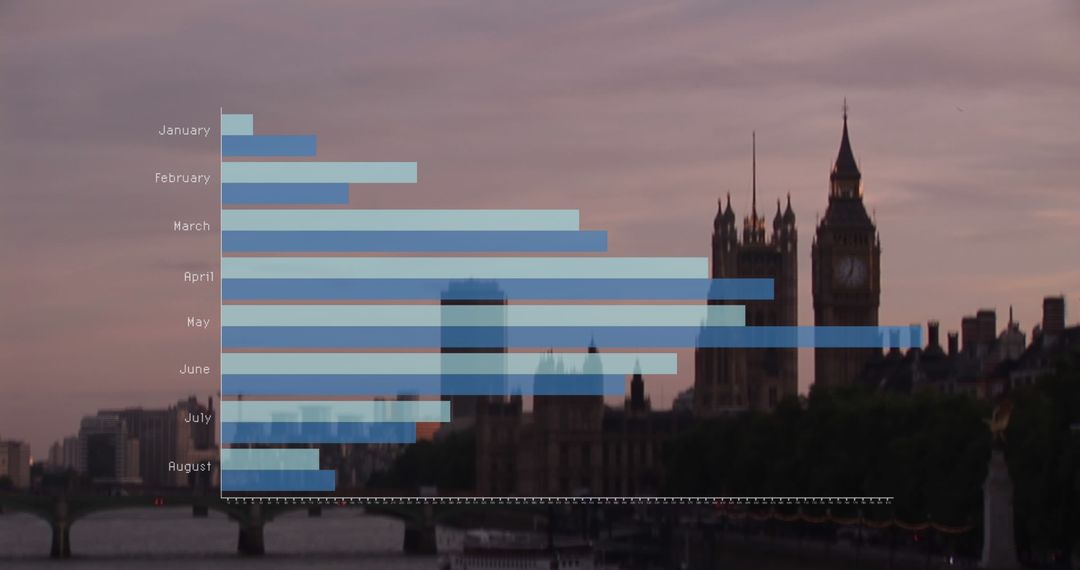
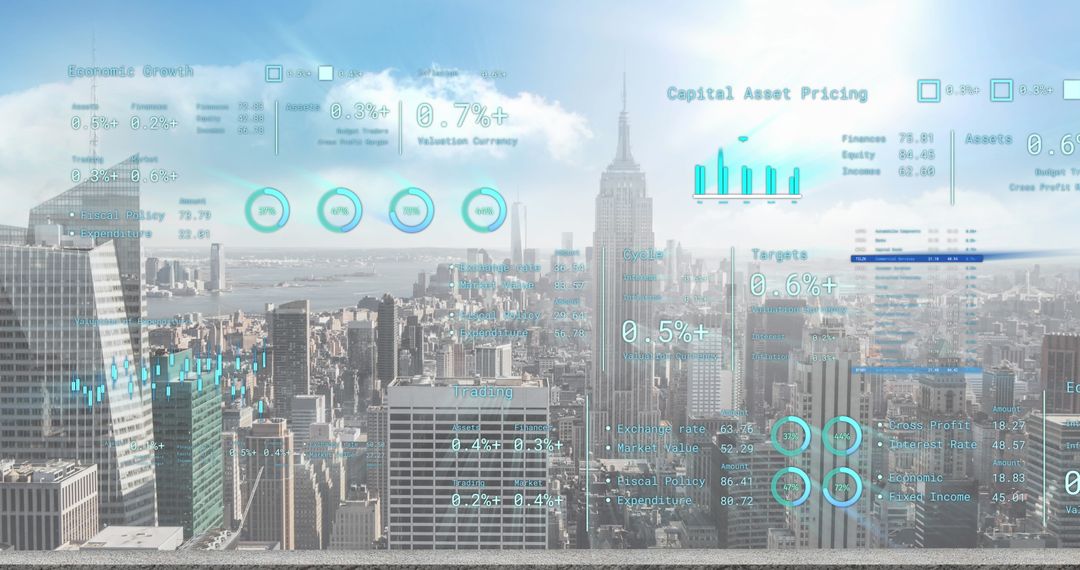
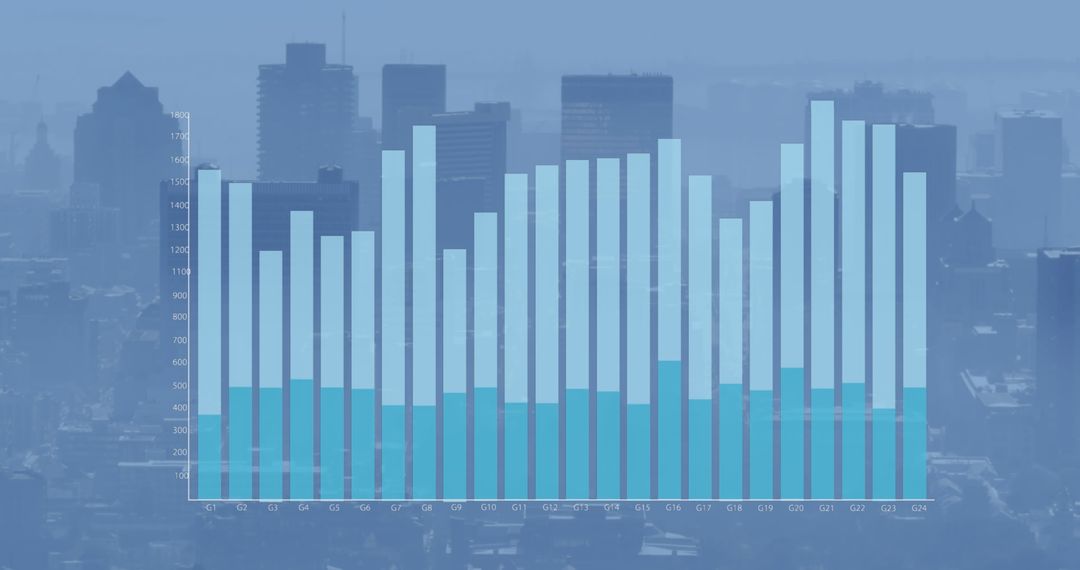
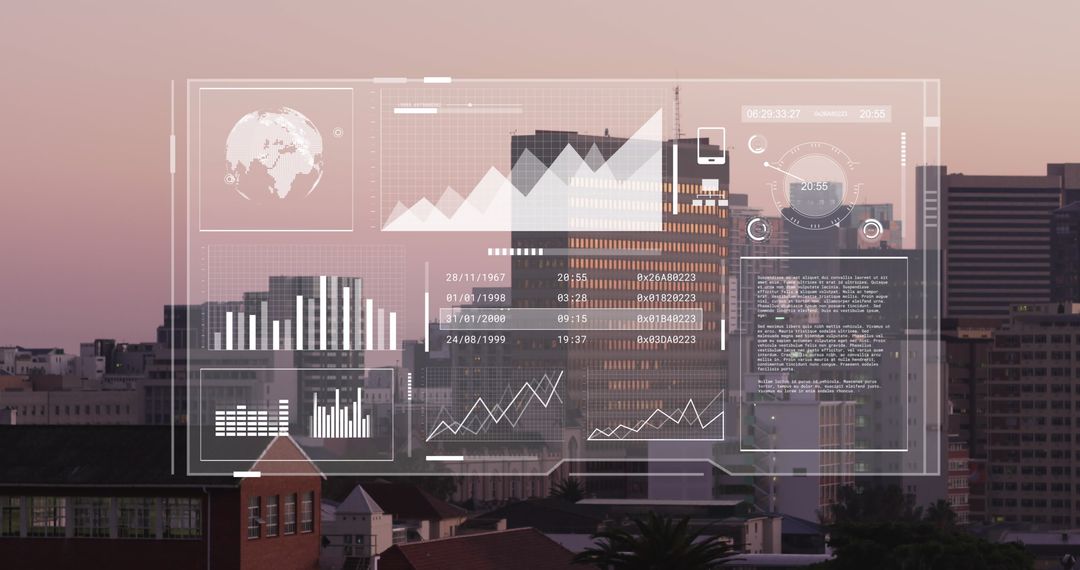
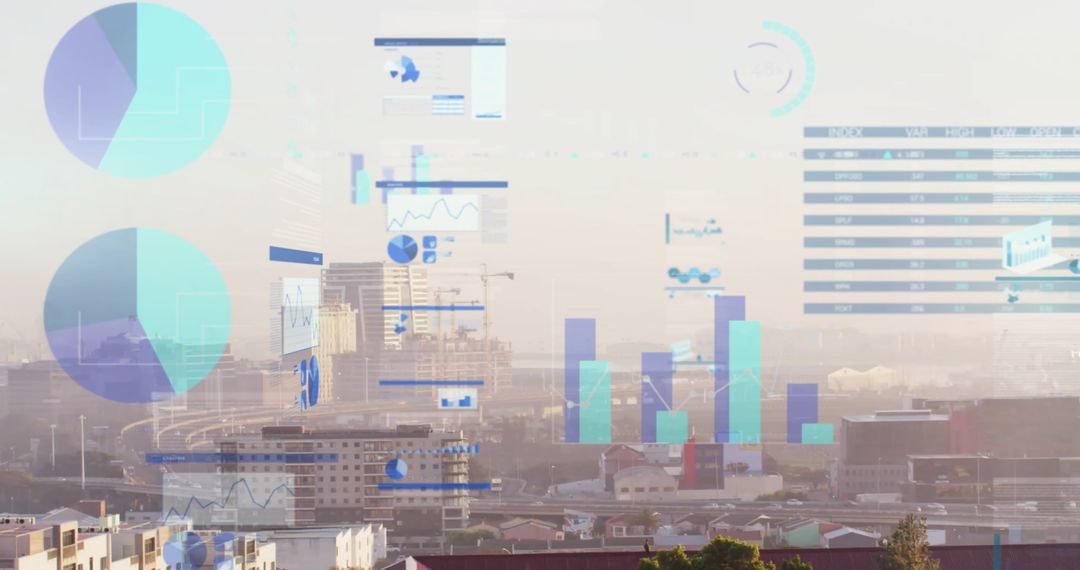
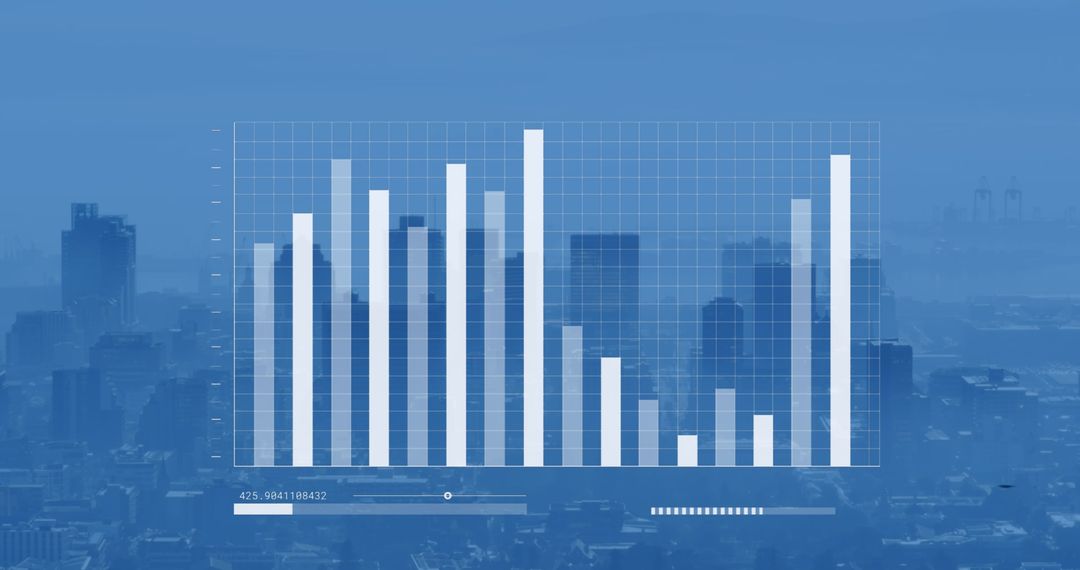
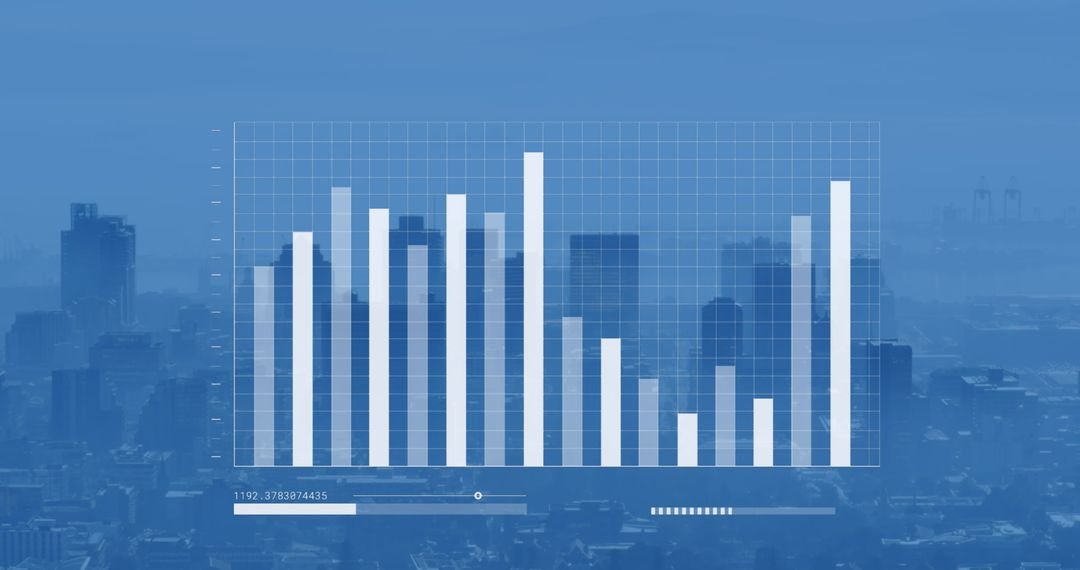
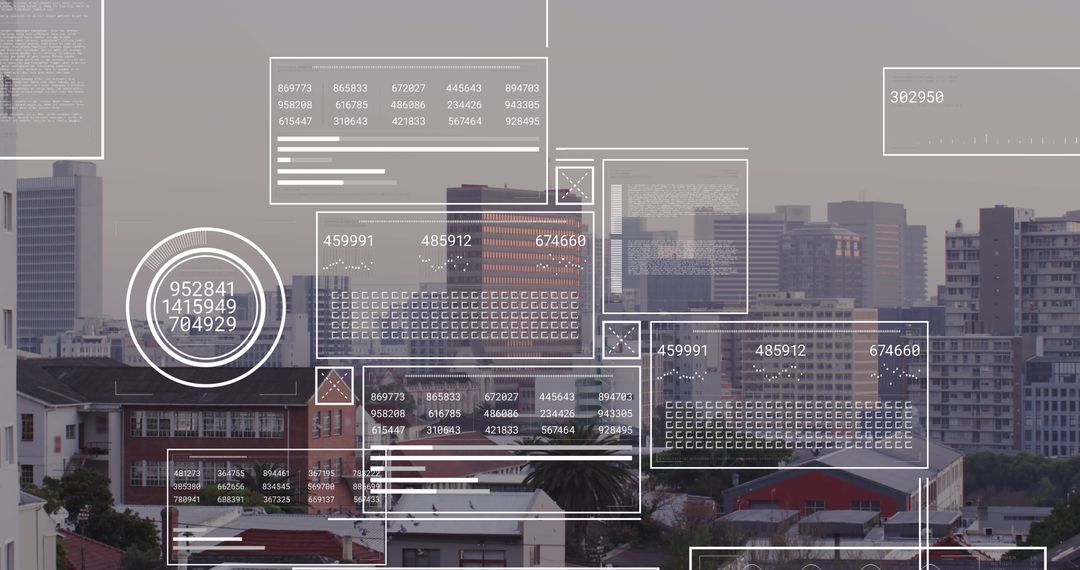
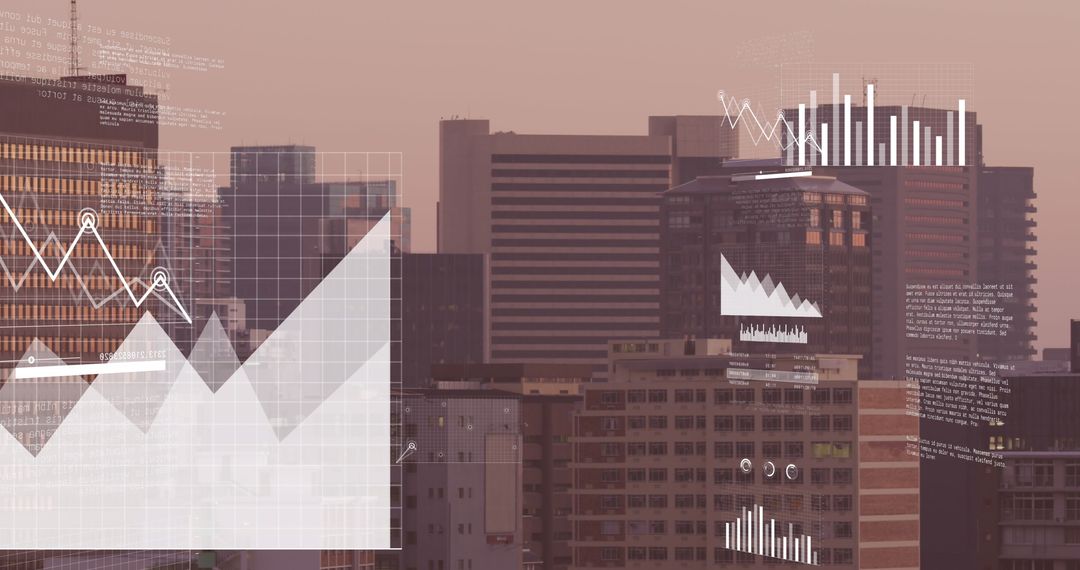
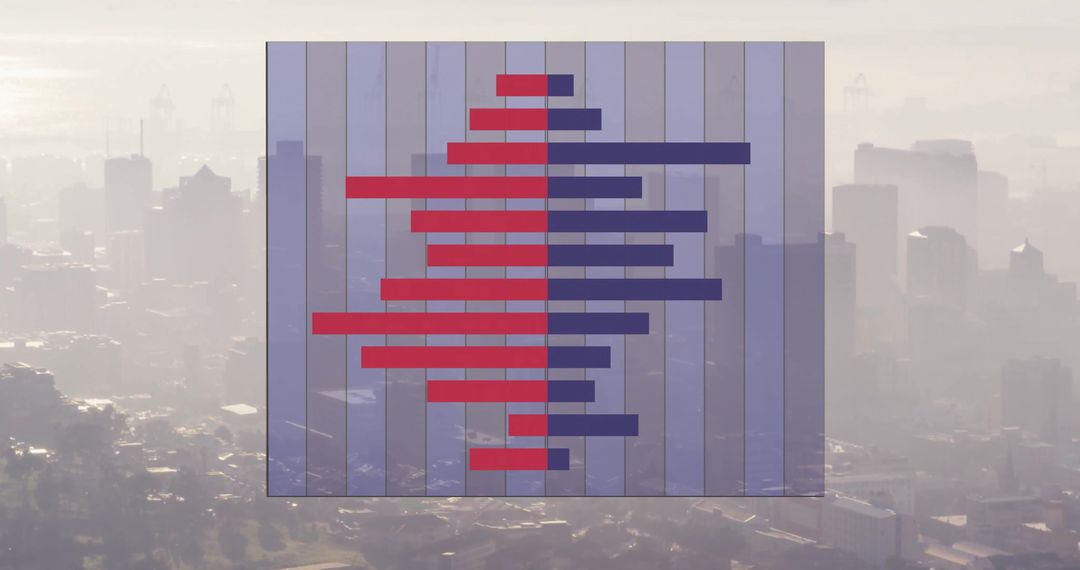
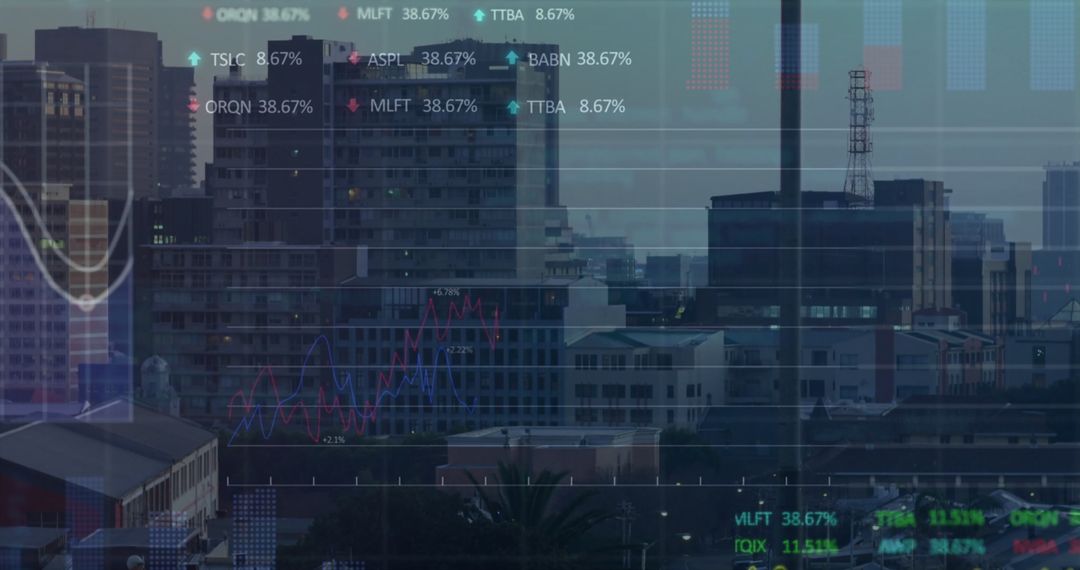
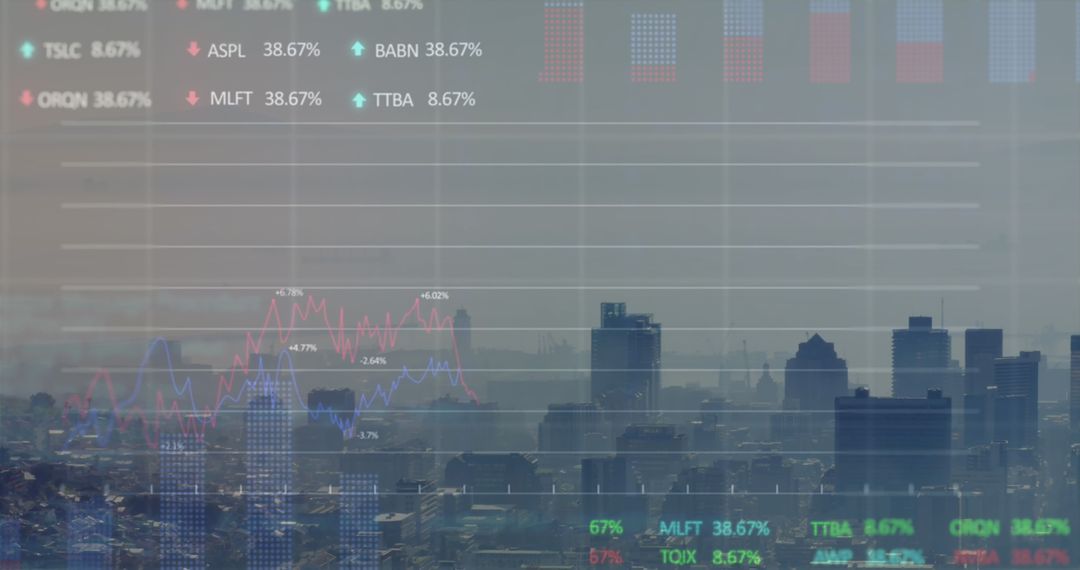
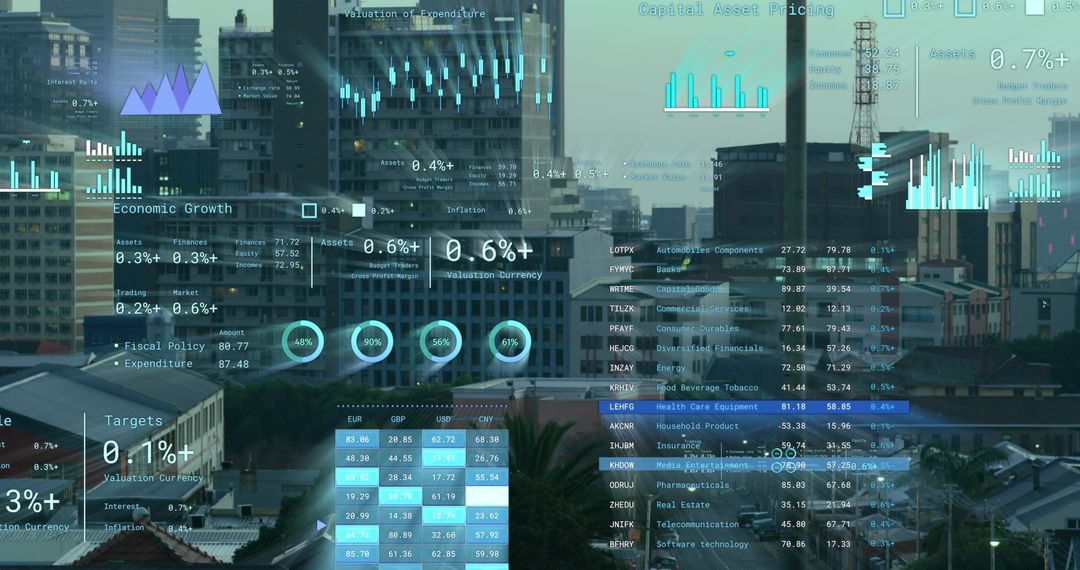
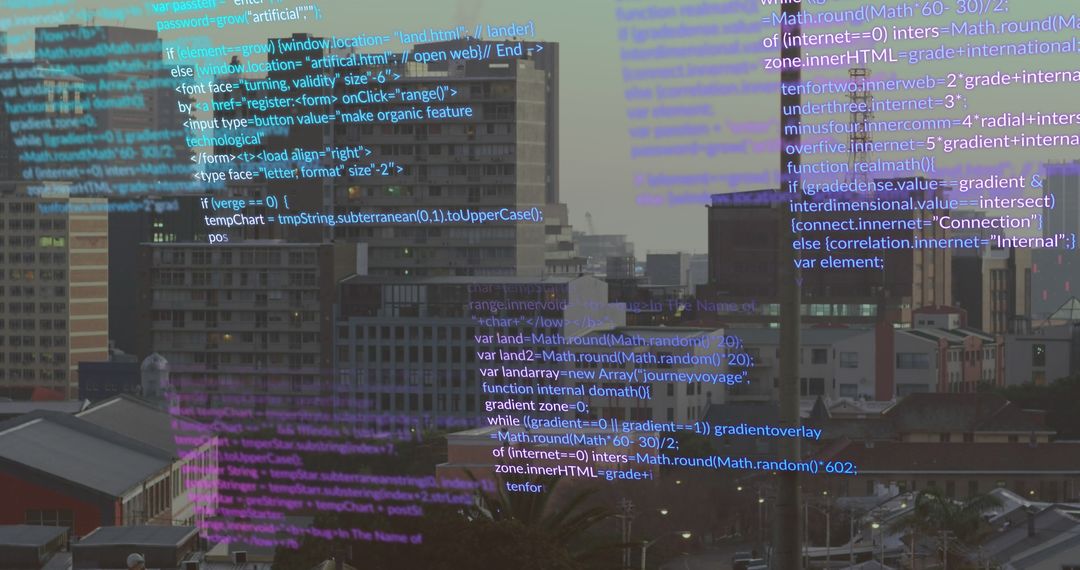
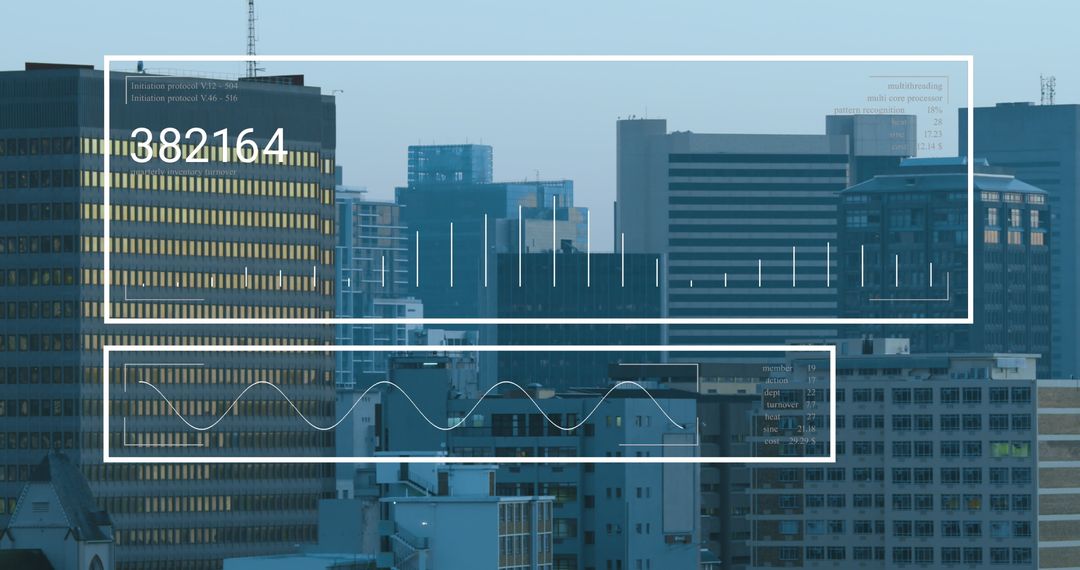
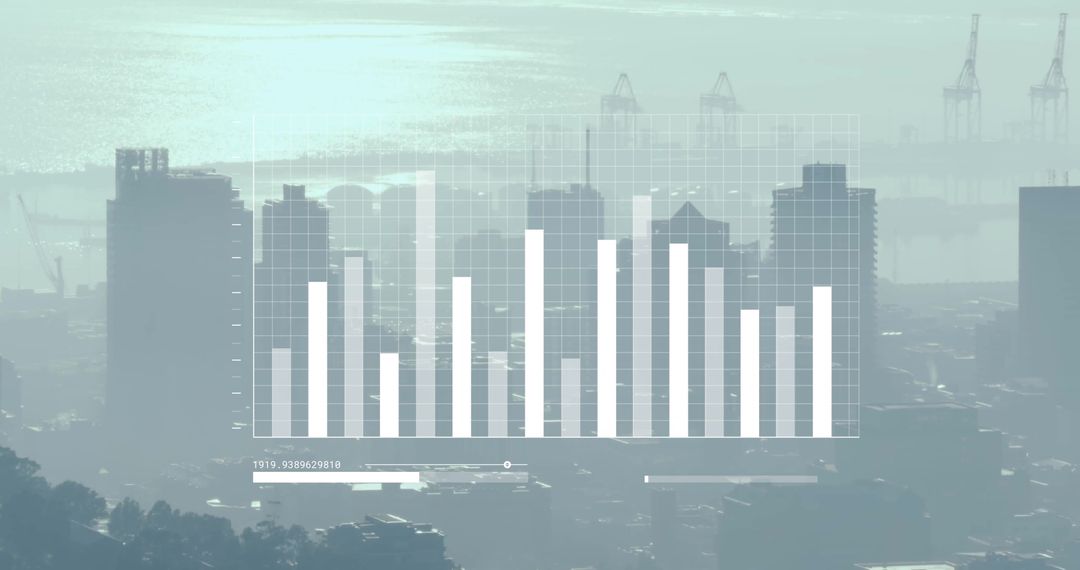
- Digital Overlaid Income and Expenditure Bar Graphs in City View
Digital Overlaid Income and Expenditure Bar Graphs in City View Image

Detailed overlaid bar graphs depicting income, expenditure, and tax patterns placed over a dynamic cityscape. The graphical display provides insights on global finance trends with urban influence. Ideal for illustrating economic analysis, financial reports, and business presentations focusing on urban economic processes.
Powered by 


2
downloads
downloads
Tags:
More
Credit Photo
If you would like to credit the Photo, here are some ways you can do so
Text Link
photo Link
<span class="text-link">
<span>
<a target="_blank" href=https://pikwizard.com/photo/digital-overlaid-income-and-expenditure-bar-graphs-in-city-view/8f19bde501b6f605a9a4a080e02b9f56/>PikWizard</a>
</span>
</span>
<span class="image-link">
<span
style="margin: 0 0 20px 0; display: inline-block; vertical-align: middle; width: 100%;"
>
<a
target="_blank"
href="https://pikwizard.com/photo/digital-overlaid-income-and-expenditure-bar-graphs-in-city-view/8f19bde501b6f605a9a4a080e02b9f56/"
style="text-decoration: none; font-size: 10px; margin: 0;"
>
<img src="https://pikwizard.com/pw/medium/8f19bde501b6f605a9a4a080e02b9f56.jpg" style="margin: 0; width: 100%;" alt="" />
<p style="font-size: 12px; margin: 0;">PikWizard</p>
</a>
</span>
</span>
Free (free of charge)
Free for personal and commercial use.
Author: People Creations
Similar Free Stock Images
Premium


Premium


Premium


Premium


Premium


Premium


Premium


Premium


Premium


Premium


Premium

Premium


Premium


Premium


Premium


Premium


Premium


Premium


Premium


Premium


Premium


Premium

Premium


Premium