
- Home >
- Stock Photos >
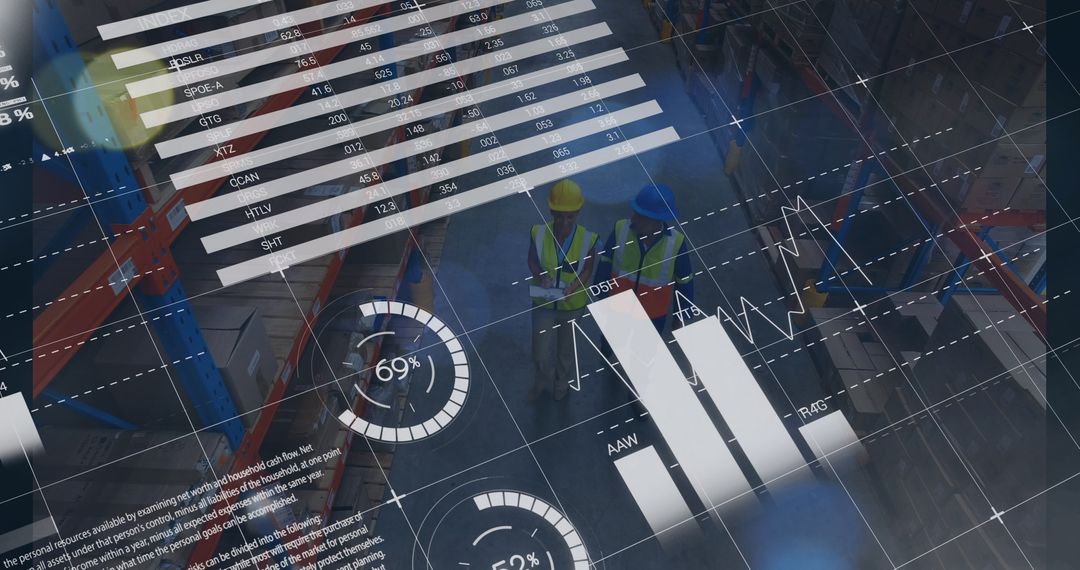
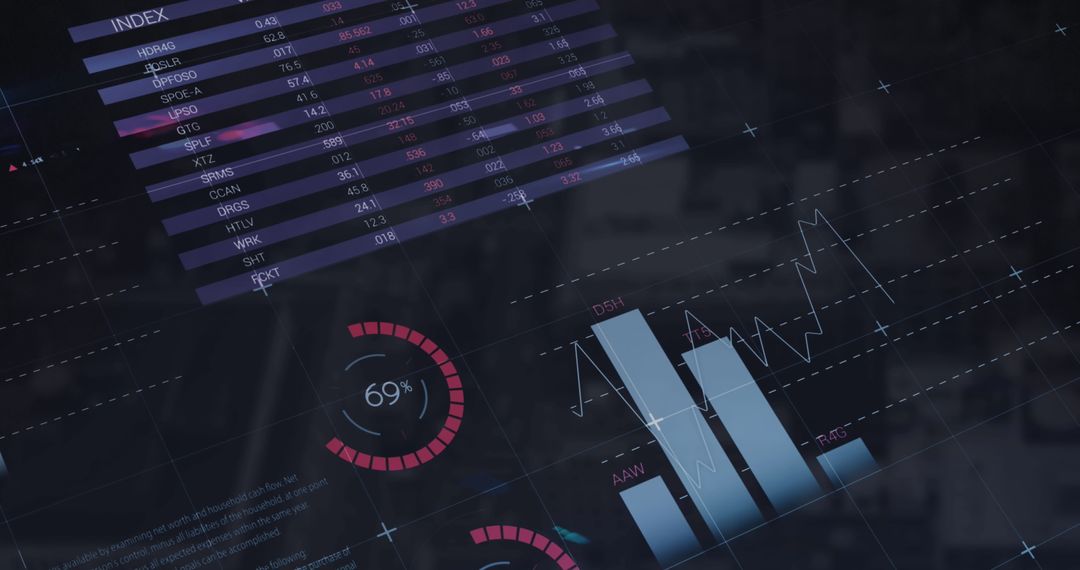
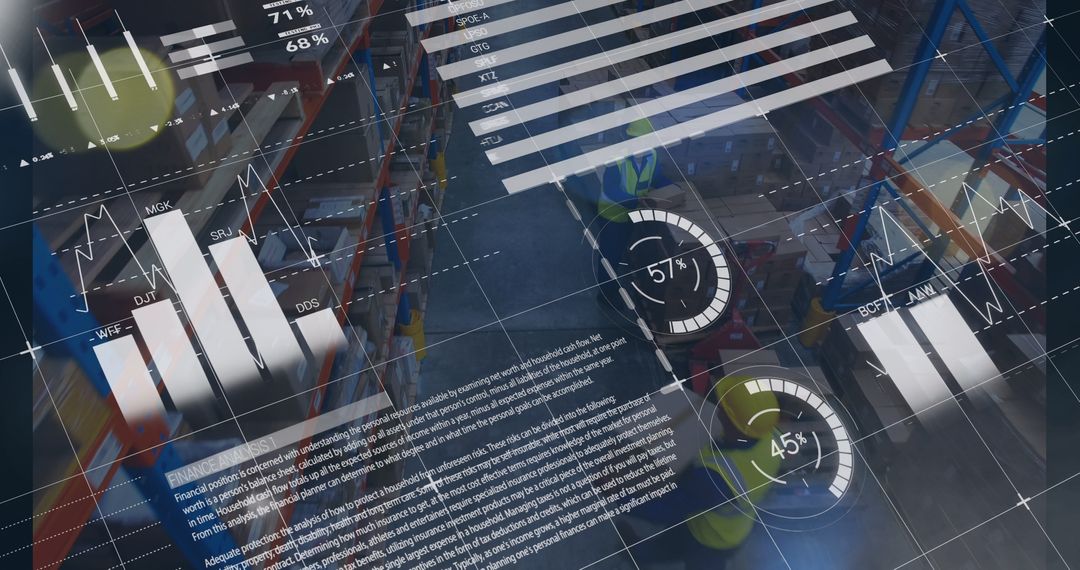
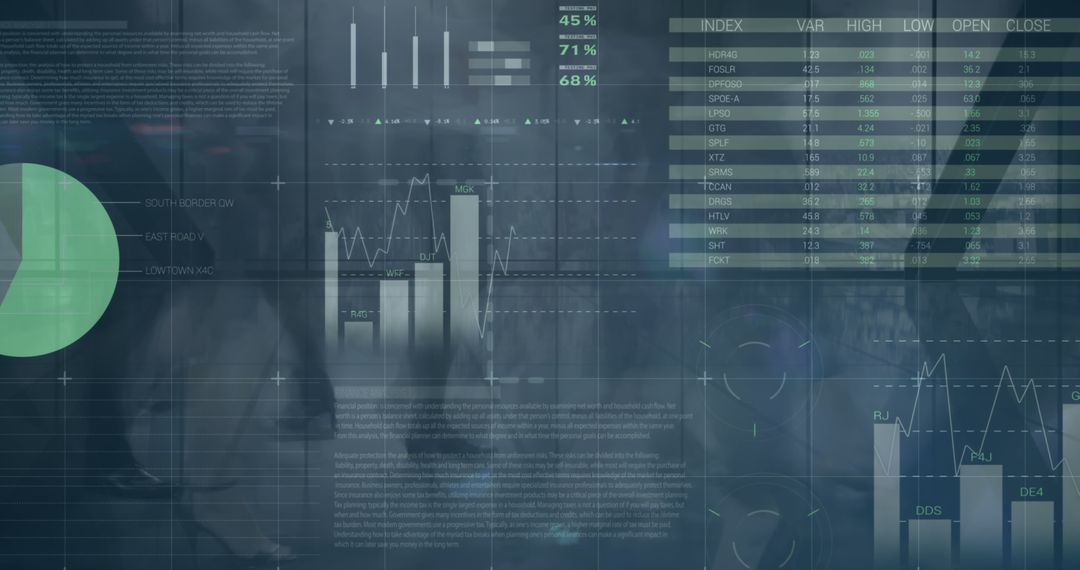
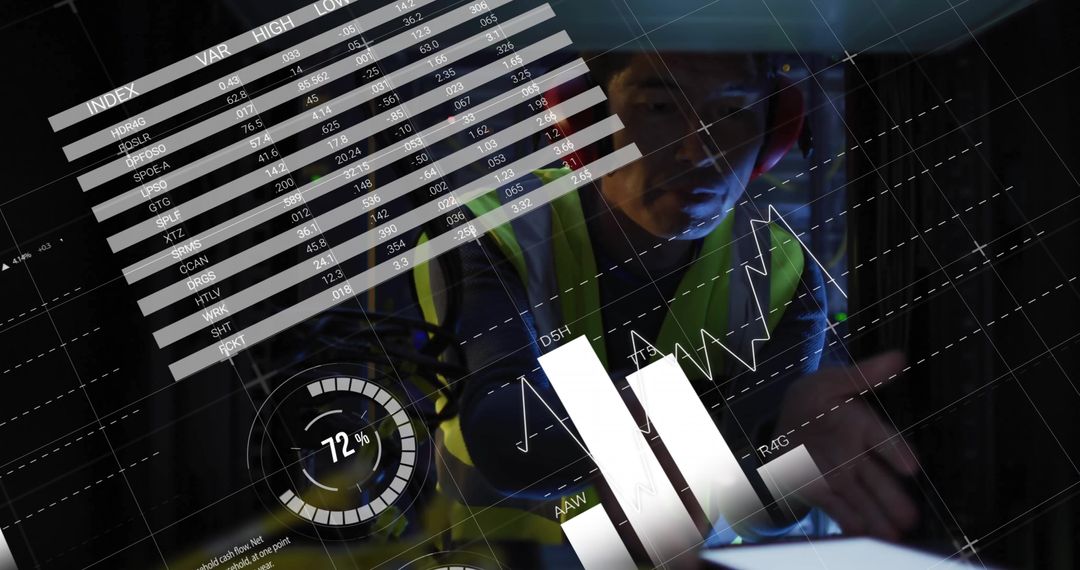
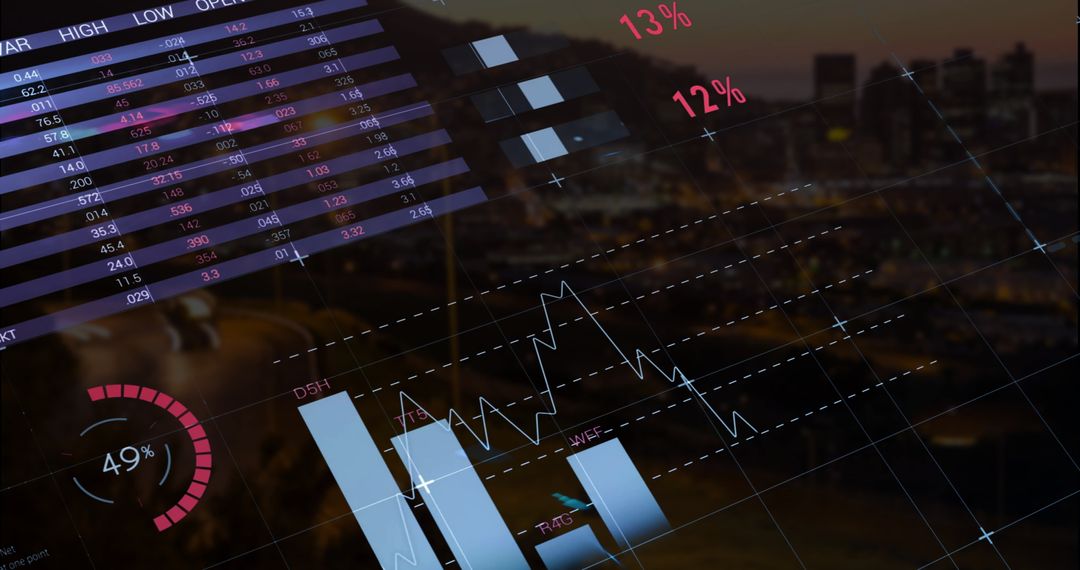
- Digital Overlay of Graphs and Warehouse Operations
Digital Overlay of Graphs and Warehouse Operations Image

Abstract representation combining digital data visualization and actual warehouse operations. Graphs and statistics suggest business analysis and monitoring of logistics performance. Suitable for concepts involving industrial efficiency, financial studies, or economic growth in the logistics sector.
Powered by  - Get 15% off with code: PIKWIZARD15


2
downloads
downloads
Tags:
More
Credit Photo
If you would like to credit the Photo, here are some ways you can do so
Text Link
photo Link
<span class="text-link">
<span>
<a target="_blank" href=https://pikwizard.com/photo/digital-overlay-of-graphs-and-warehouse-operations/4debf5d0b1025a3e14e0750f42c9402b/>PikWizard</a>
</span>
</span>
<span class="image-link">
<span
style="margin: 0 0 20px 0; display: inline-block; vertical-align: middle; width: 100%;"
>
<a
target="_blank"
href="https://pikwizard.com/photo/digital-overlay-of-graphs-and-warehouse-operations/4debf5d0b1025a3e14e0750f42c9402b/"
style="text-decoration: none; font-size: 10px; margin: 0;"
>
<img src="https://pikwizard.com/pw/medium/4debf5d0b1025a3e14e0750f42c9402b.jpg" style="margin: 0; width: 100%;" alt="" />
<p style="font-size: 12px; margin: 0;">PikWizard</p>
</a>
</span>
</span>
Free (free of charge)
Free for personal and commercial use.
Author: Creative Art
Similar Free Stock Images

Premium


Premium


Premium


Premium


Premium


Premium


Premium


Premium


Premium


Premium


Premium


Premium


Premium


Premium


Premium


Premium


Premium


Premium


Premium


Premium


Premium


Premium


Premium


Premium

