- Home >
- Stock Photos >
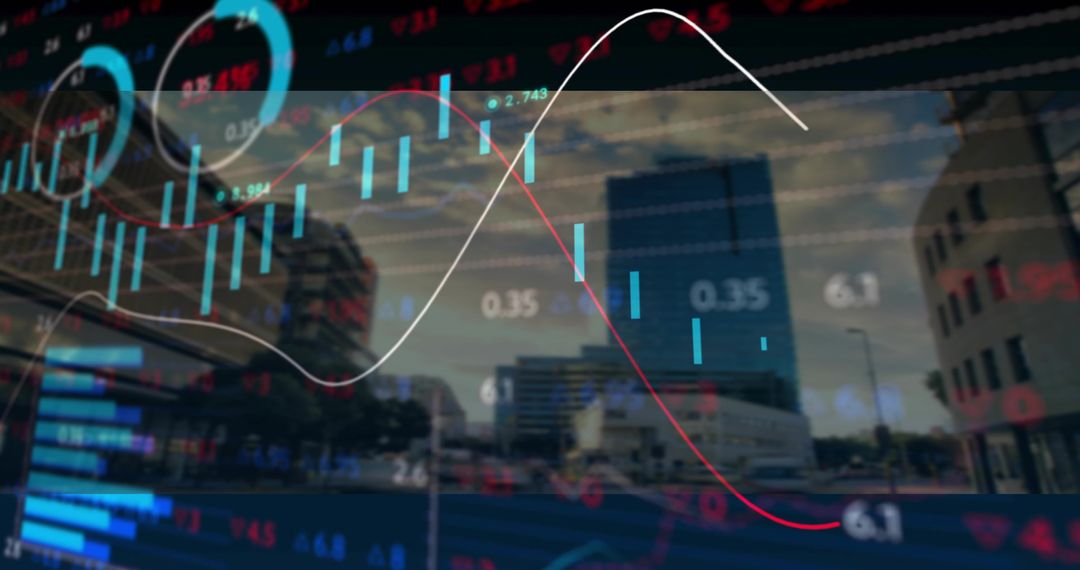
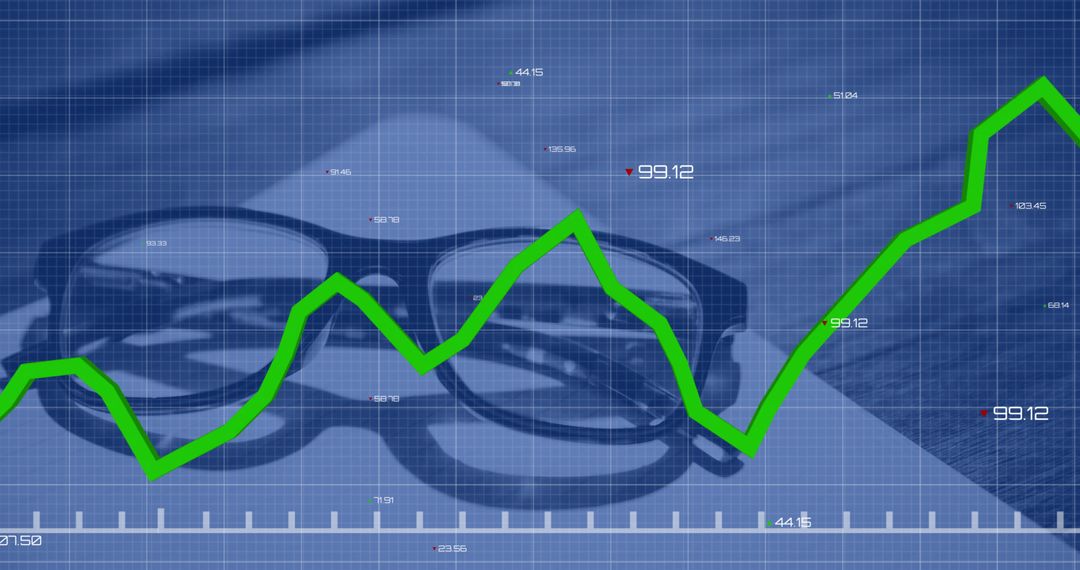
- Digital Perspective of Analytics in Modern Office
Digital Perspective of Analytics in Modern Office Image

Digital view combines data visualizations, including graphs and charts, with empty office environment. Ideal for use in technology marketing, illustrating business analytics software, or depicting futuristic corporate environments.
Powered by  - Get 15% off with code: PIKWIZARD15


2
downloads
downloads
Tags:
More
Credit Photo
If you would like to credit the Photo, here are some ways you can do so
Text Link
photo Link
<span class="text-link">
<span>
<a target="_blank" href=https://pikwizard.com/photo/digital-perspective-of-analytics-in-modern-office/28cc88075b3a4bcac0da95b45c355066/>PikWizard</a>
</span>
</span>
<span class="image-link">
<span
style="margin: 0 0 20px 0; display: inline-block; vertical-align: middle; width: 100%;"
>
<a
target="_blank"
href="https://pikwizard.com/photo/digital-perspective-of-analytics-in-modern-office/28cc88075b3a4bcac0da95b45c355066/"
style="text-decoration: none; font-size: 10px; margin: 0;"
>
<img src="https://pikwizard.com/pw/medium/28cc88075b3a4bcac0da95b45c355066.jpg" style="margin: 0; width: 100%;" alt="" />
<p style="font-size: 12px; margin: 0;">PikWizard</p>
</a>
</span>
</span>
Free (free of charge)
Free for personal and commercial use.
Author: Awesome Content
Similar Free Stock Images

Premium


Premium


Premium


Premium


Premium


Premium


Premium


Premium


Premium


Premium


Premium


Premium


Premium


Premium


Premium


Premium


Premium


Premium


Premium


Premium


Premium


Premium


Premium


Premium