
- Home >
- Stock Photos >
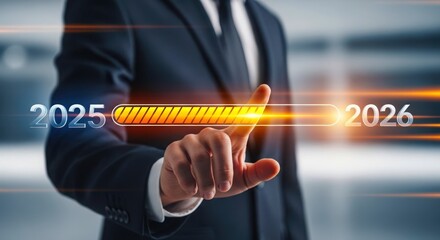
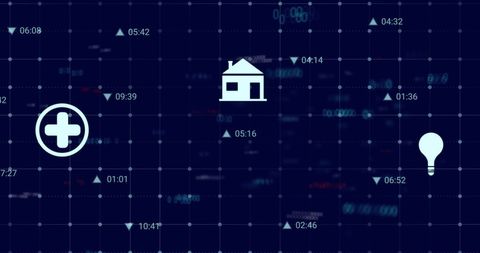
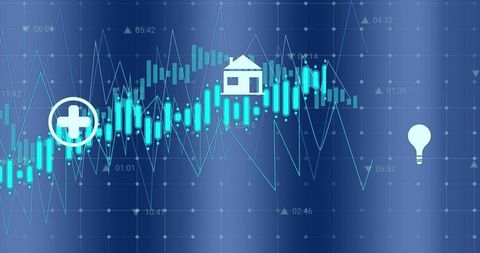
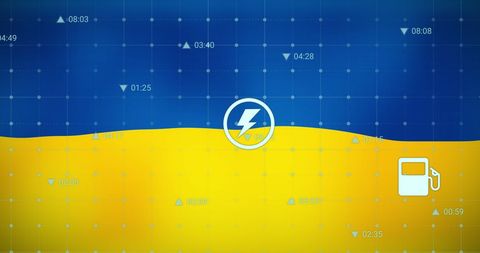
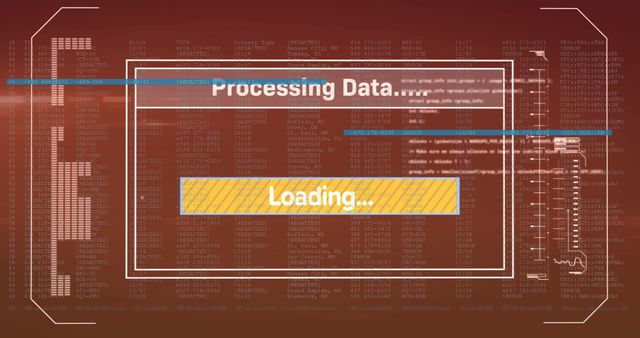
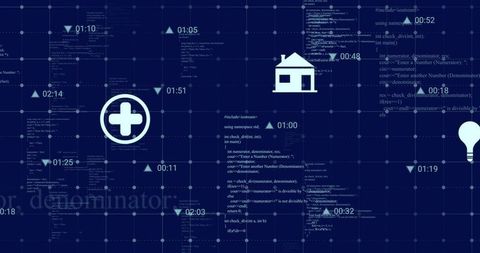
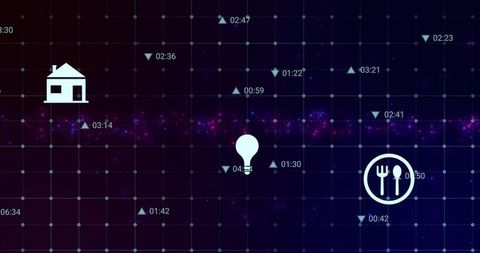
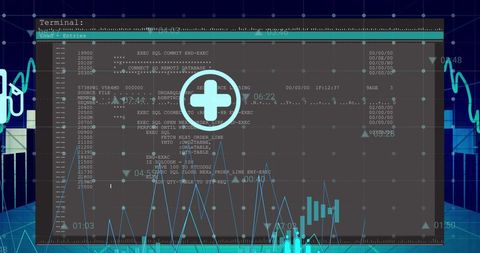
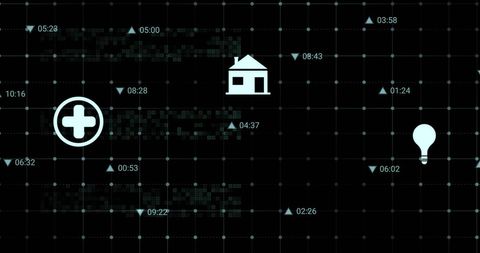
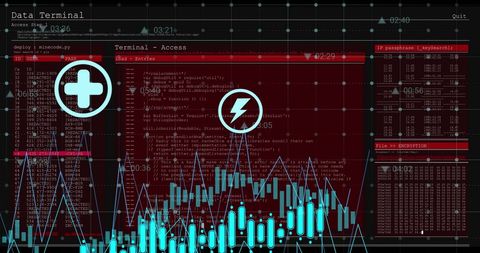
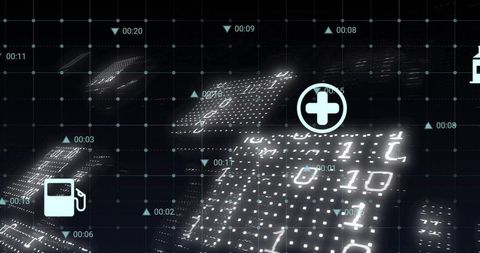
- Digital Progress Bar with Icons and Data Analysis Grid
Digital Progress Bar with Icons and Data Analysis Grid Image
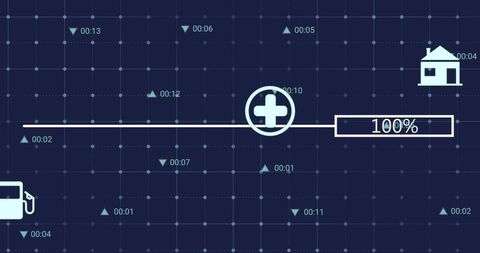
Illustration featuring a sleek and futuristic digital progress bar set against a blue grid background. White plus icon overlay suggests an emphasis on health or addition, while gas pump and house symbols represent different data types or sectors affected by the displayed analytics. Small timestamps add a sense of time-tracked information accuracy, data velocity, or process monitoring, culminating in achieving a target of 100%. Suitable for presentations, tech blogs, user-interface examples, infographic creators, or digital progress forecasts visual aids.
Powered by 


downloads
Tags:
More
Credit Photo
If you would like to credit the Photo, here are some ways you can do so
Text Link
photo Link
<span class="text-link">
<span>
<a target="_blank" href=https://pikwizard.com/photo/digital-progress-bar-with-icons-and-data-analysis-grid/42fbe0e0ce51fd5a72f5781000b305af/>PikWizard</a>
</span>
</span>
<span class="image-link">
<span
style="margin: 0 0 20px 0; display: inline-block; vertical-align: middle; width: 100%;"
>
<a
target="_blank"
href="https://pikwizard.com/photo/digital-progress-bar-with-icons-and-data-analysis-grid/42fbe0e0ce51fd5a72f5781000b305af/"
style="text-decoration: none; font-size: 10px; margin: 0;"
>
<img src="https://pikwizard.com/pw/medium/42fbe0e0ce51fd5a72f5781000b305af.jpg" style="margin: 0; width: 100%;" alt="" />
<p style="font-size: 12px; margin: 0;">PikWizard</p>
</a>
</span>
</span>
Free (free of charge)
Free for personal and commercial use.
Author: People Creations
Similar Free Stock Images
Loading...

Premium

Premium
Premium


Premium


Premium


Premium


Premium

Premium
Premium

Premium


Premium


Premium


Premium


Premium


Premium


Premium


Premium


Premium

Premium


Premium


Premium
Premium

Premium


Premium


Premium

Explore More Free Stock Images