
- Home >
- Stock Photos >
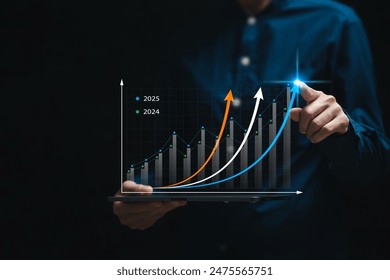
- Digital Progress Trends in Data Analytics Concept
Digital Progress Trends in Data Analytics Concept Image

Visualization of upward trend in data analytics revealing growth and improvement using a bar chart. The use of digital elements underscores a tech-forward approach which is suitable for illustrating technological advancements, financial success, or business projections in presentations, reports, and marketing materials.
Powered by  - Get 15% off with code: PIKWIZARD15


downloads
Tags:
More
Credit Photo
If you would like to credit the Photo, here are some ways you can do so
Text Link
photo Link
<span class="text-link">
<span>
<a target="_blank" href=https://pikwizard.com/photo/digital-progress-trends-in-data-analytics-concept/fe5c740403c8c1f65a0c2ec28320be2e/>PikWizard</a>
</span>
</span>
<span class="image-link">
<span
style="margin: 0 0 20px 0; display: inline-block; vertical-align: middle; width: 100%;"
>
<a
target="_blank"
href="https://pikwizard.com/photo/digital-progress-trends-in-data-analytics-concept/fe5c740403c8c1f65a0c2ec28320be2e/"
style="text-decoration: none; font-size: 10px; margin: 0;"
>
<img src="https://pikwizard.com/pw/medium/fe5c740403c8c1f65a0c2ec28320be2e.jpg" style="margin: 0; width: 100%;" alt="" />
<p style="font-size: 12px; margin: 0;">PikWizard</p>
</a>
</span>
</span>
Free (free of charge)
Free for personal and commercial use.
Author: Creative Art
Similar Free Stock Images

Premium


Premium


Premium


Premium


Premium


Premium


Premium


Premium


Premium


Premium


Premium


Premium


Premium


Premium


Premium

Premium


Premium


Premium


Premium


Premium


Premium

Premium


Premium

Premium

Premium


Explore More Free Stock Images