
- Home >
- Stock Photos >
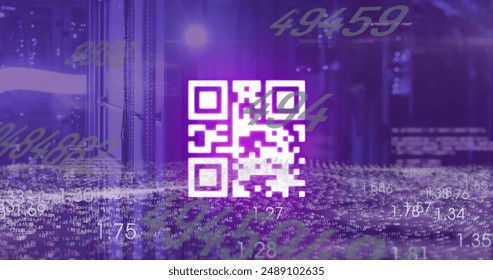
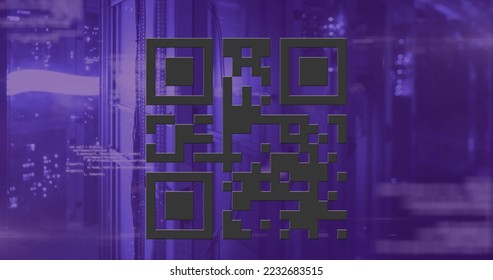
- Digital QR Code with Analyzing Data and Network Visualization
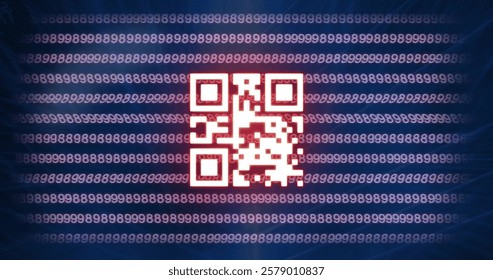
Digital QR Code with Analyzing Data and Network Visualization Image

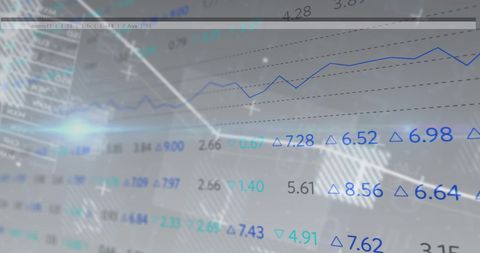
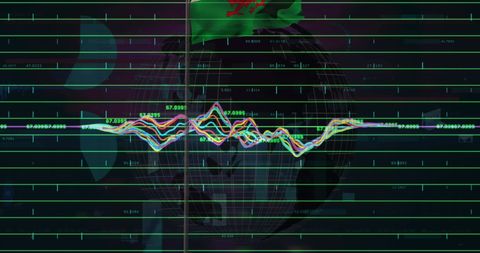
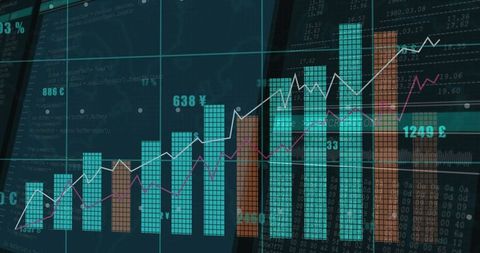
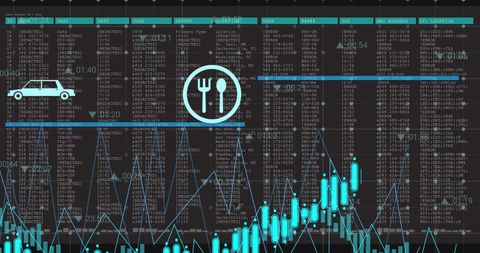
This dynamic illustration represents the merging of traditional and digital information with a prominent QR code interacting with rolling statistics and global network data. Ideal for highlighting themes of technological advancement, data visualization, and connectivity. Useful for presentations, marketing materials, or publications discussing cybersecurity, data processing, or digital technology trends.
Powered by  - Get 15% off with code: PIKWIZARD15


downloads
Tags:
More
Credit Photo
If you would like to credit the Photo, here are some ways you can do so
Text Link
photo Link
<span class="text-link">
<span>
<a target="_blank" href=https://pikwizard.com/photo/digital-qr-code-with-analyzing-data-and-network-visualization/d4bef31d6e7009ce36f775b8a0abc590/>PikWizard</a>
</span>
</span>
<span class="image-link">
<span
style="margin: 0 0 20px 0; display: inline-block; vertical-align: middle; width: 100%;"
>
<a
target="_blank"
href="https://pikwizard.com/photo/digital-qr-code-with-analyzing-data-and-network-visualization/d4bef31d6e7009ce36f775b8a0abc590/"
style="text-decoration: none; font-size: 10px; margin: 0;"
>
<img src="https://pikwizard.com/pw/medium/d4bef31d6e7009ce36f775b8a0abc590.jpg" style="margin: 0; width: 100%;" alt="" />
<p style="font-size: 12px; margin: 0;">PikWizard</p>
</a>
</span>
</span>
Free (free of charge)
Free for personal and commercial use.
Author: Creative Art
Similar Free Stock Images

Premium

Premium

Premium


Premium


Premium


Premium


Premium


Premium


Premium


Premium


Premium


Premium


Premium


Premium

Premium

Premium


Premium


Premium


Premium

Premium


Premium

Premium


Premium

Premium

Premium
Explore More Free Stock Images