1. Home > 
  2. Stock Photos > 
  3. Digital Representation of Financial Data and Stock Market Analytics

Digital Representation of Financial Data and Stock Market Analytics Image

Digital Representation of Financial Data and Stock Market Analytics

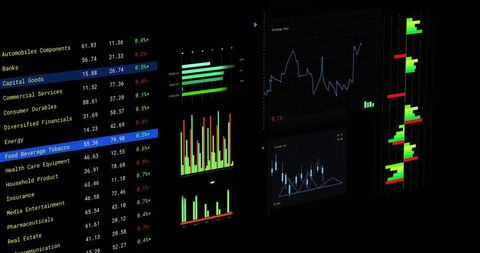
Visual displays of complex financial data represent trends in modern economics and the global market. Useful for presentations on investment strategies, business finance, or technology in finance. Ideal for illustrating financial reports or educational resources about stock market analysis.

Powered by Shutterstock logo - Get 15% off with code: PIKWIZARD15
Analysis finance grow graph and market  investment. Financial  business plan,earnings,sale and strategy. Stock market chart, exchange financial growth diagram. - Powered by Shutterstock - Get 15% off with code: PIKWIZARD15Financial Expert Reviews Market Projections and Investment Strategies on Computer - Powered by Shutterstock - Get 15% off with code: PIKWIZARD15Online trading, Investment, Strategy market plan, and Stock mark - Powered by Shutterstock - Get 15% off with code: PIKWIZARD15Businessman works on laptop Showing business analytics dashboard with charts, metrics, and KPI to analyze performance and create insight reports for operations management. Data analysis concept.Ai - Powered by Shutterstock - Get 15% off with code: PIKWIZARD15Young indian business man trader wearing glasses looking at computer screen with trading charts reflecting in eyeglasses watching stock trading market financial data growth concept, close up. - Powered by Shutterstock - Get 15% off with code: PIKWIZARD15

Credit Photo

If you would like to credit the Photo, here are some ways you can do so

Free (free of charge)

Free for personal and commercial use.

Author: Awesome Content

Similar Free Stock Images

Loading...
Dynamic Financial Data Graph in Digital Grid Display
Premium
Businessman using KPI dashboard.Financial business KPI System data analytics graph dashboard.Data System KPI and metrics connected in database for follow earnings,operations and sales data.
Dynamic Digital Data Analysis on Elevated Grid
Financial Data Charts with World Map on Blue Digital Background
Premium
Financial advisor explaining invest stock market data consulting investor. Two busy business men analysts doing finance trading analysis pointing at exchange chart on laptop screen working in office.
Financial Stock Market Data Analysis on Digital Interface
Digital Finance: Modern Stock Market Analysis Display
Analyzing Accelerating Data Trends on Grid with Tech Insights
Financial Data Line Graph on Digital Display
Premium
Stock market chart,Stock market data on LED display concept.
Digital Data Network with Dynamic Connections
Financial Data Processing with Digital Patterns for Global Business
Dynamic Financial Growth Digital Chart Display
Data Analytics Graphs on Digital Interface Background
Premium
Stock market or forex trading graph on touchscreen,  finance and investment concept. Economy trends for business, financial charts and digits.
Holographic Charts with Social Media Notifications
Financial Data Processing with Rising Graphs
Colorful Bar Graph with Data Overlay on Black Background
Dynamic Statistical Data Analysis on Digital Grid Network
Abstract Digital Charts with Social Media Metrics Rising
Data Visualization on Security Shield Interface for Cyber Security
Financial Data Analysis Vibrant Graphs on Blue Background
NFT Financial Data Visualization with Digital Graph Overlay
Premium
Close up laptop screen view with stocks charts and graphs over shoulder of female crypto trader, analyze financial stock, makes trade market research, buy or sell cryptocurrency, review risk or profit
Digital Data Processing Over Black Background with Green Code
Digital Financial Data Analysis on Grid Framework
Futuristic Digital Data Analysis Interface Visualization
Digital Data Processing with Graph and Grid Technology Interface
Premium
Man look at the dashboard with graphs and charts. Concept of data management system, business intelligence, data statistics, marketing analysis, key performance indicators (KPI) and analytics.
Premium
Businessman Drawing Upward Arrow on Digital Stock Market Graph with Trading Data, Buy and Sell Indicators, Representing Financial Growth, Investment Success Foreign currency trading and Forex Trading
Digital DNA and Brain Data Interface Display in Dark Theme
Futuristic Digital Interface with DNA and Brain Diagrams
Digital Stock Market Trends and Financial Growth Analysis
Financial Data Visualization with Cityscape Overlay
Digital Cardiograph Display with Heart Rate and SpO2 Monitors
Falling Line Graph on Navy Background Illustrating Economic Decline
Futuristic Digital Interface with Spiraling Coding Patterns
Economic Trends Analysis with Financial Indicators and Graphs
Premium
Office man finger touch hud, virtual screen with stock market changes, business candlesticks graph chart. Double exposure of blue and white lines, growing numbers, online trading
Financial Data Display in Digital Grid Design
Digital Financial Data with Graph and Grid Patterns
Data Security with Tech Bar Graph Overlay
Analyzing Data Trends on Digital Graph Interface
Futuristic Financial Data Visualization on Digital Interface
Digital Financial Data Overlay on Urban Street Scene
Abstract Digital Finance Chart Showing Fluctuating Graph Lines
Dynamic Business Data and Cityscape Visualization
Premium
Business Financing Accounting Banking Concept, Businesswoman doing finances and calculating financial report with business graph growth chart, finance and investment, business analysis concept
Colorful Data Visualization on Dark Background
Sound Wave Visualization with Programming Code Elements
Financial Graphs with Social Media Analytics on Digital Chart
Financial Data Processing Visualization with Green Digital Grid
Digital Data Flow with Infographics Hologram
Dynamic Financial Data Processing in Green Sphere
Analyzing Financial Data on Digital World Map Background
Cityscape with Digital Stock Market Graphs and Statistics
Premium
Magnifying glass and documents with analytics data lying on table,selective focus
Futuristic Data Terminal with Code and Digital Interface Overlay
Abstract Digital Data Graph and Diagrams on Gray Background
Dynamic Financial Data Displays Stock Market Trends
Global Financial Data Analysis with Green Growth Arrows on Blue Background
Digital Interface Visualizing DNA and Data Patterns
Digital Data Processing with Chart in Futuristic Interface
Digital Currency Trading Interface with Data Visualization
Financial Data Overlay on Cityscape Visualizing Market Trends
Premium
Analyst working with Financial Data and Business Analytics Dashboard on computer to make Financial Report with KPI and Metrics. Investment, Corporate Finance, Strategy, Operations, Sales.
Colorful Digital ECG Heartbeat Graphs on Black Background
Financial Data Graph Rendering Global Market Trends
Dynamic Green Stock Chart on Digital Grid Background
Premium
Explore the stock market trends for 2024 with analytical visuals of businessman planning long term investments and future business growth, Navigate towards success with smart strategies.
Fluctuating Digital Stock Market Data Chart
Premium
Businessman using laptop computer analyzing sales data and financial growth graph chart report. Business planning, strategy and development. Financial accounting. market research, data analysis
Cybersecurity Interface with Digital Shield Icon Displayed
Digital Financial Data Analysis with Graphs and Stock Market Trends
Dynamic Data Visualization and Financial Growth Curves
Premium
Analyst working with Financial Report and Business Analytics Dashboard on laptop computer to analyze Financial Data with KPI and Metrics. Investment, Operations, Sales, Corporate Finance, Strategy.
Premium
Business strategy development and growing growth plan.	
Financial management strategy for business growth.Graph and chart. Investment of growth on currency rate.
Financial Data Analysis with Code Interface on Black Background
Dynamic Stock Market Analysis with Multicolored Statistics
Data Analysis with Advanced Technology Interface Details Profusion
Financial Growth Graph and Data Analytics Representation
Premium
Finance, business, investment, or economy growing graph concept. A man tapping on top of an arrow, analyzed data, as it rising up high. The chart and arrows represening the growth and increase.
Premium
Businessmen work with stock market investments using tablets to analyze trading data. smartphone with stock exchange graph on screen. Financial stock market.
Premium
Businessman works on laptop Showing business analytics dashboard by ai with charts, metrics, and KPI to analyze performance and create insight reports for operations management. Data analysis concept.
Dynamic Stock Market Analysis Concept Artwork
Financial Data Analysis and Digital Interface Concept
Financial Data Analysis with Futuristic Technology Interface
Dynamic Financial Data Overlaid on Grid Background
Premium
Man look at the dashboard with graphs and charts. Concept of data management system, business intelligence, data statistics, marketing analysis, key performance indicators (KPI) and analytics.
Financial Graph with Data Analysis and Market Statistics
Dynamic Stock Market Chart with Fluctuating Trends and Data Points
Dynamic Graphic of Financial Data Displayed on Graph
Futuristic Digital Representation of DNA Strand
Premium
Digital, night and a businessman with technology for the stock market, finance analysis and research. Data, office and an employee reading statistics, stocks and analytics in the dark on tech at work
Financial Data Streaming with Arrows Over Graphic Indicators
Digital Financial Data Overlaying City Skyline at Dusk
Dynamic Financial Data Visualization over Urban Silhouette
Premium
Businesswomen use magnifier glass find stock in stock markets, uptrends, growth economics, business strategy development, and opportunities for investment, take profit from funds, Financial Analyst.
Financial Data Flow against Urban Skyline Backdrop
Rising Digital Graph and Data Visualizations on Black Background
Data Analytics and Financial Growth Indicators
Dynamic Stock Market Analytics Display on Blue Background
Digital Data Visualization with Blue Grid and Timeline
Digital Financial Data Processing Interface on Red Background
Abstract Digital Interface for Medical Data Processing
Premium
Business man trader investor analyst using mobile phone app analytics for cryptocurrency financial market analysis, trading data index chart graph on smartphone and laptop screen. Over shoulder view
Digital Financial Data Analysis with Infographics and Charts
Financial Data Analysis with Declining Trends
Dynamic Financial Data Visualizations on Grid Interface
Analyzing Stock Market Data Trends with Futuristic Visuals
Digital Data Visualization with Trend Lines and Percentage Changes
Premium
Trader analyzing data on virtual screen.Price graph and indicator. Stock market invest and crypto currency. Stock market and business investment.
Rising Graph Line on Digital Green Grid Background
Rising Financial Data Graph on Digital Grid Background
Holographic Financial Data Visualization with Stock Trends
Data Analysis Graphics on Digital Grid Background
Premium
Analytical data and development statistics. Web analytics and product testing techniques are being measured. A guy studies an SEO dashboard and a digital report.
Dynamic Financial Graphs Overlaying Modern Cityscape
Dynamic Financial Data on Digital Screen
Fluctuating Financial Graph on Green Grid Background
Abstract Financial Data Processing and Analysis Interface
Premium
Stock market chart,Stock market data on LED display concept.
Global Cyber Security Data Interface on Dark Background
Digital Financial Data Graph on Black Screen Background
Abstract Digital DNA Helix with Geometric Patterns and Nodes