- Home >
- Stock Photos >
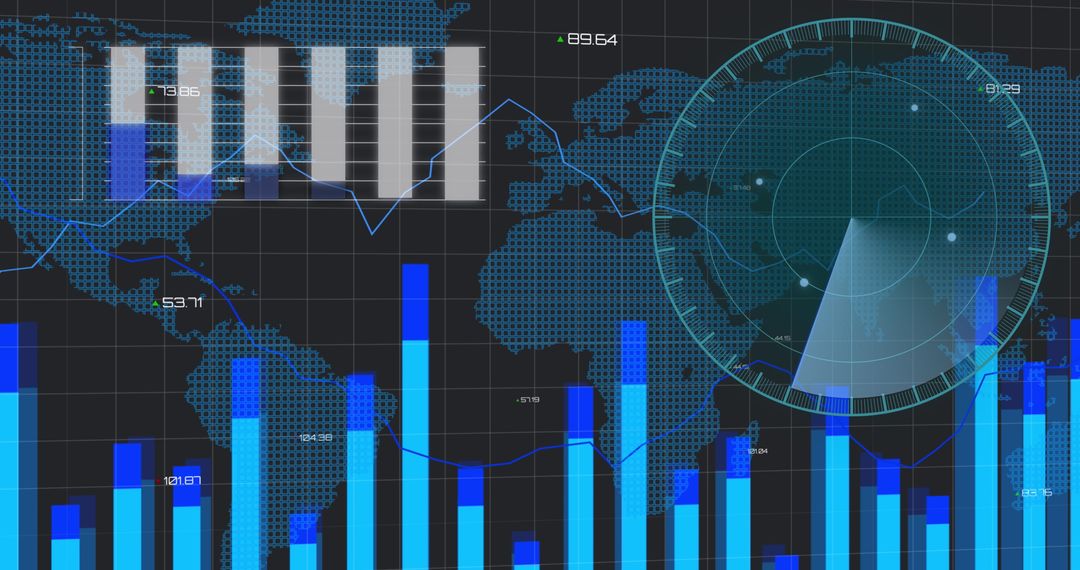
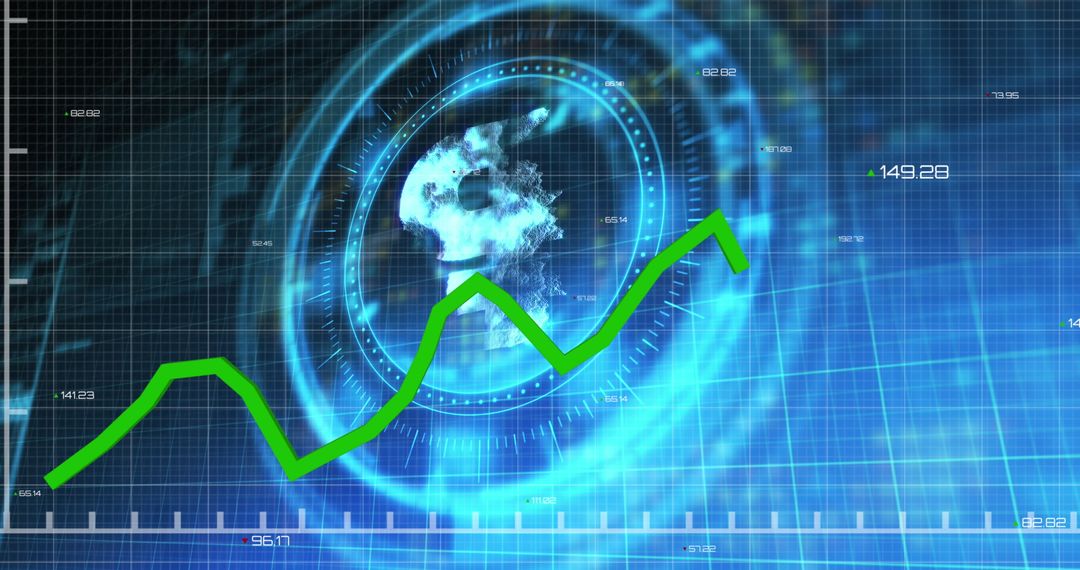
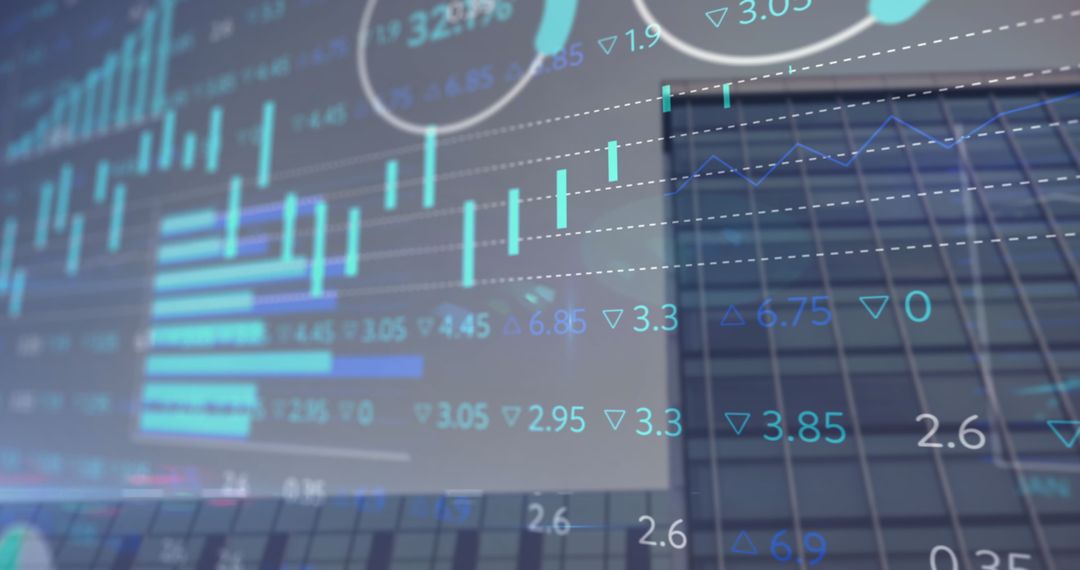
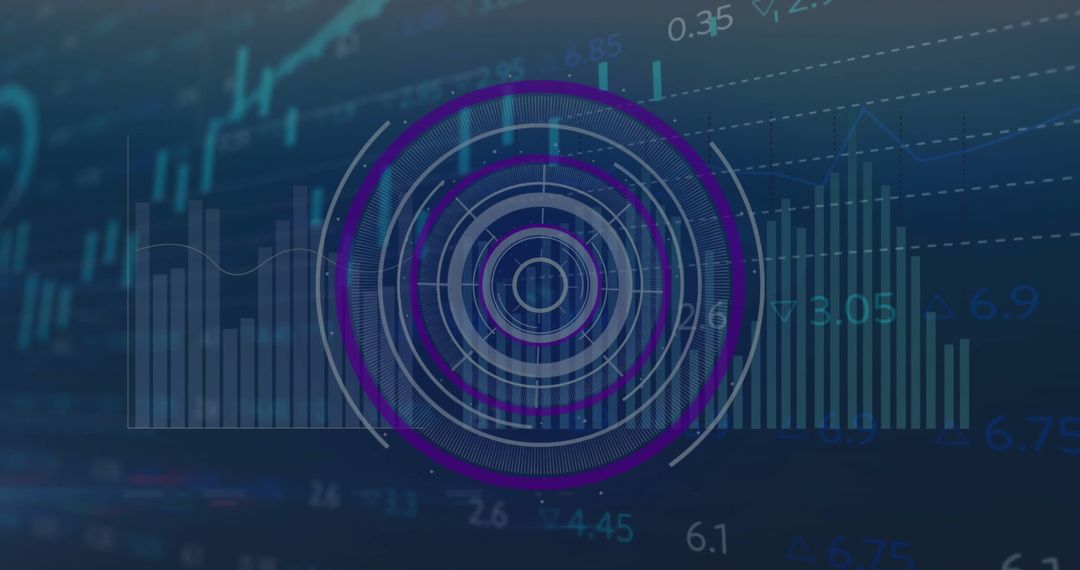
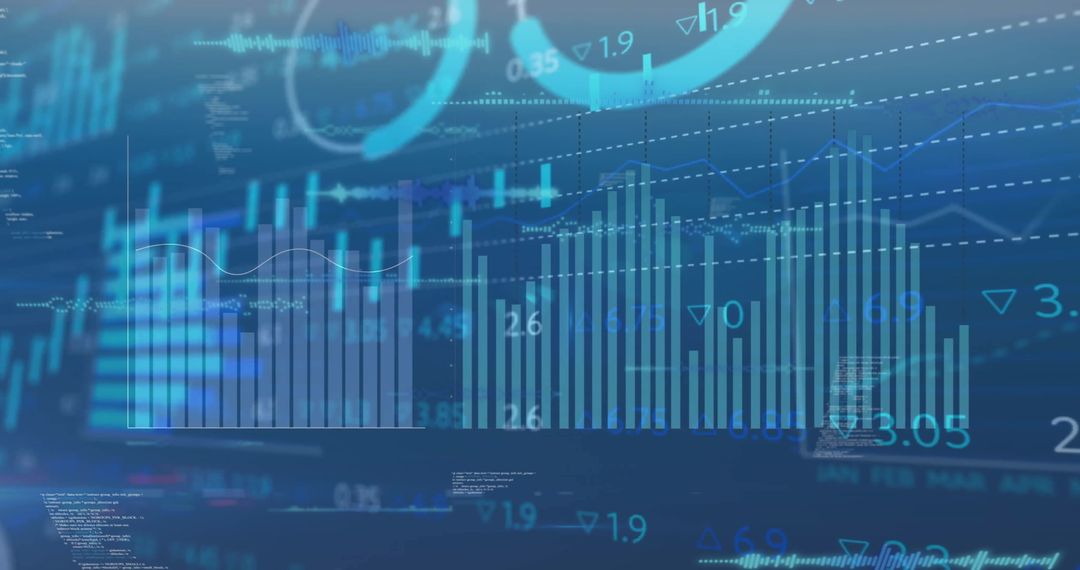
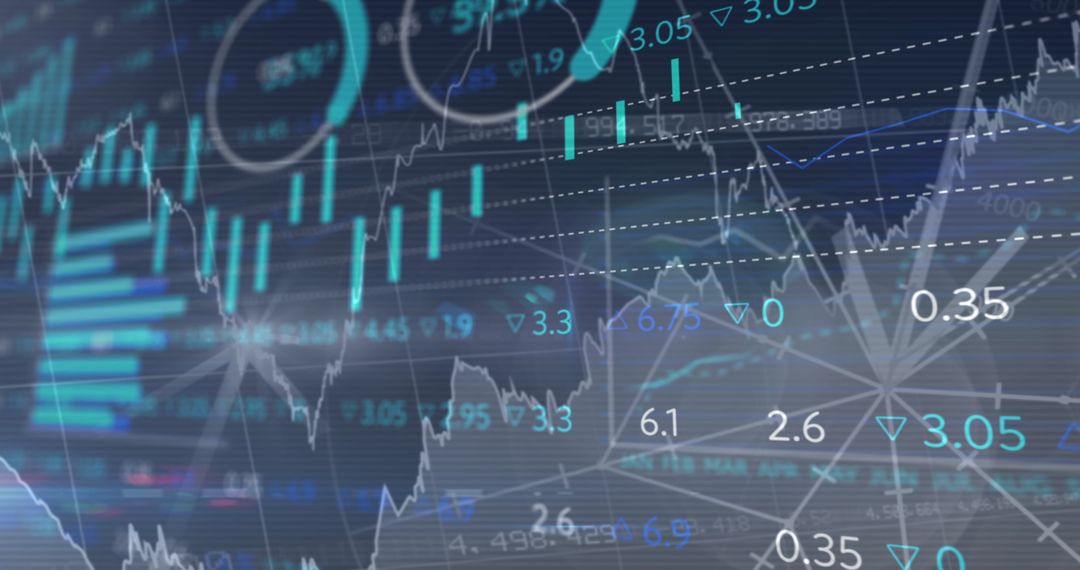
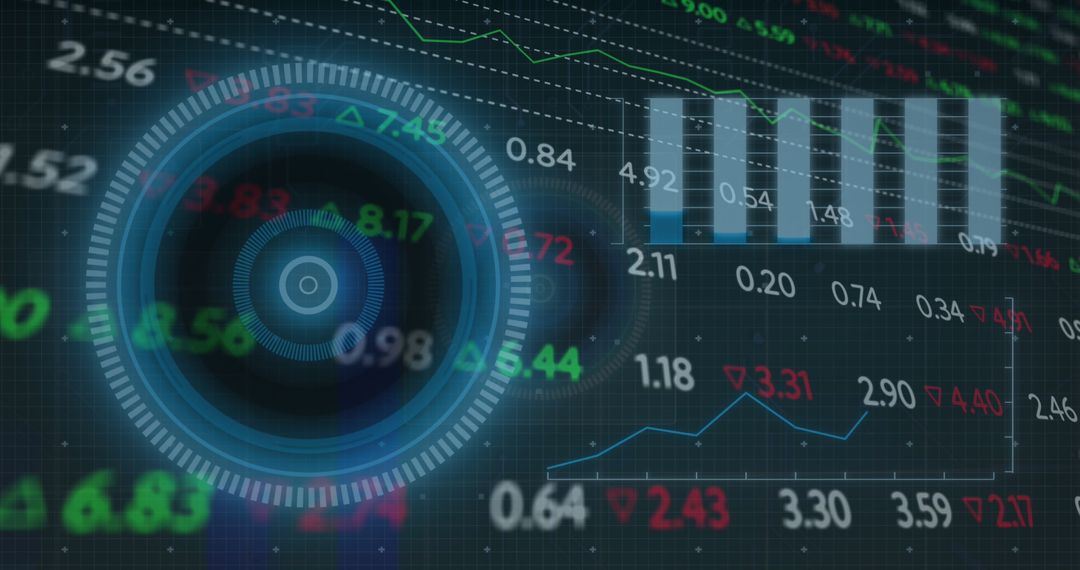
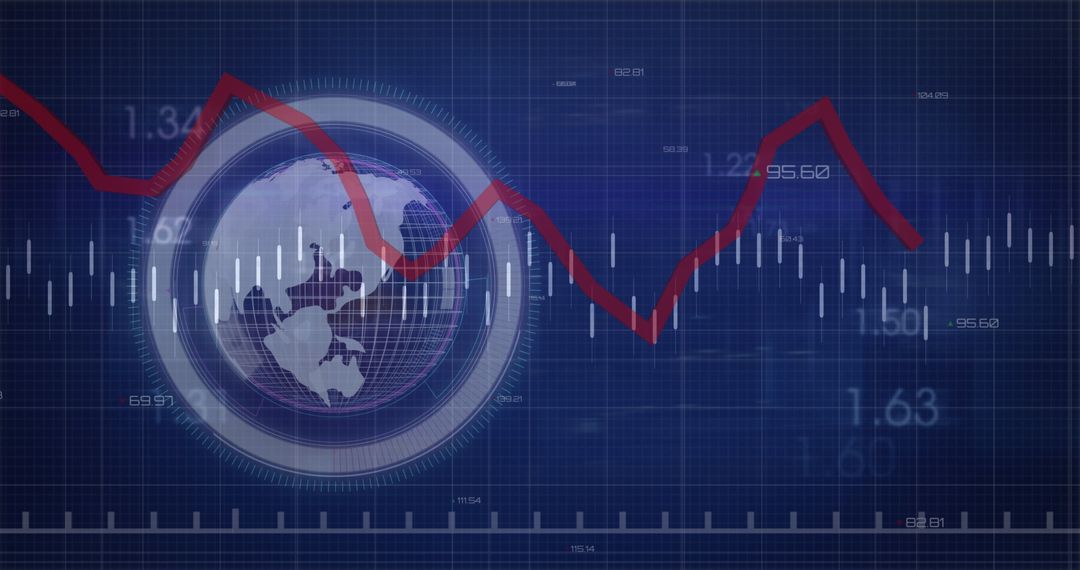
- Digital Scanner Analyzing Financial Data and Stock Market
Digital Scanner Analyzing Financial Data and Stock Market Image

Futuristic digital scanner interpreting financial and business data against a blue background. Suitable for illustrating themes related to finance technology, market analysis, economic forecasting, and data-driven decision making.
Powered by  - Get 15% off with code: PIKWIZARD15


2
downloads
downloads
Tags:
More
Credit Photo
If you would like to credit the Photo, here are some ways you can do so
Text Link
photo Link
<span class="text-link">
<span>
<a target="_blank" href=https://pikwizard.com/photo/digital-scanner-analyzing-financial-data-and-stock-market/e34a8e287bc346f90a214a9fd213c4ac/>PikWizard</a>
</span>
</span>
<span class="image-link">
<span
style="margin: 0 0 20px 0; display: inline-block; vertical-align: middle; width: 100%;"
>
<a
target="_blank"
href="https://pikwizard.com/photo/digital-scanner-analyzing-financial-data-and-stock-market/e34a8e287bc346f90a214a9fd213c4ac/"
style="text-decoration: none; font-size: 10px; margin: 0;"
>
<img src="https://pikwizard.com/pw/medium/e34a8e287bc346f90a214a9fd213c4ac.jpg" style="margin: 0; width: 100%;" alt="" />
<p style="font-size: 12px; margin: 0;">PikWizard</p>
</a>
</span>
</span>
Free (free of charge)
Free for personal and commercial use.
Author: Awesome Content
Similar Free Stock Images
Premium


Premium


Premium


Premium


Premium


Premium


Premium


Premium


Premium


Premium


Premium


Premium


Premium


Premium


Premium


Premium


Premium


Premium


Premium


Premium


Premium


Premium


Premium


Premium