- Home >
- Stock Photos >
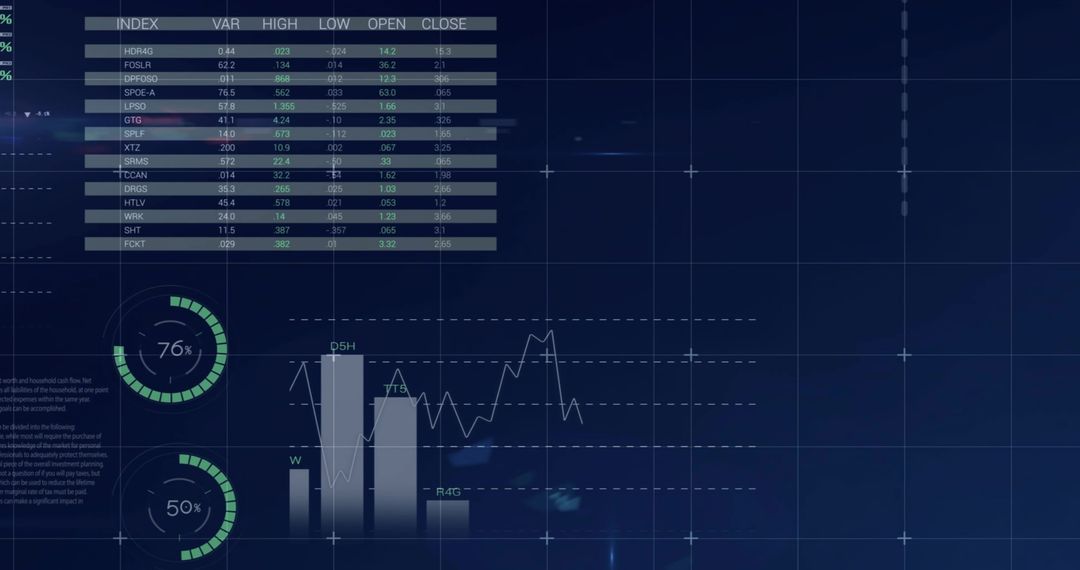
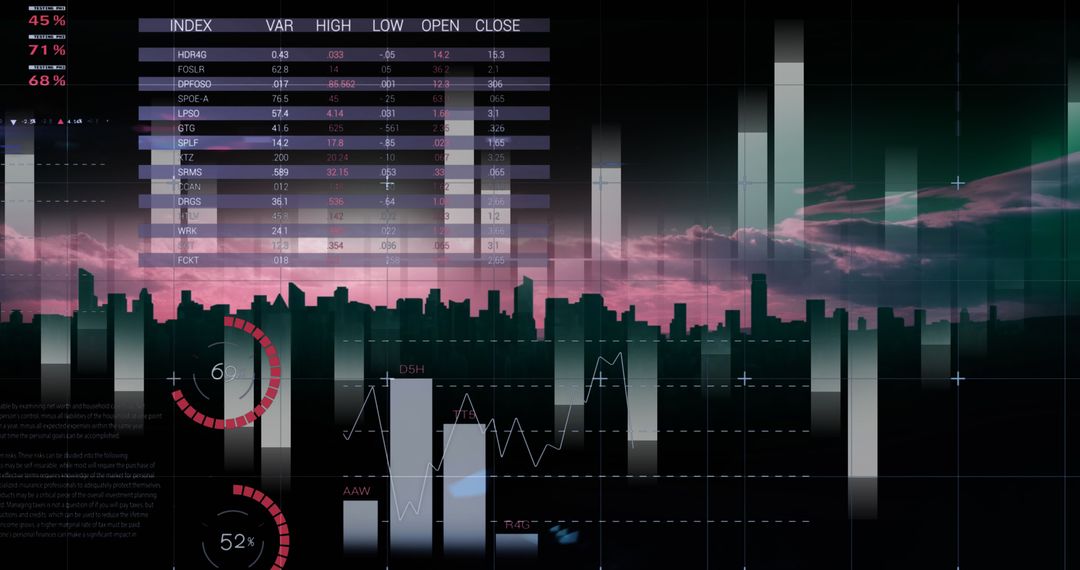
- Digital Screen Displaying Stock Market Index Data Trends
Digital Screen Displaying Stock Market Index Data Trends Image

Background featuring multiple indices with graphs and numbers emphasizing patterns and trends. Useful for themes on trading, financial analysis, market reports and business news presentations.
Powered by 


2
downloads
downloads
Tags:
More
Credit Photo
If you would like to credit the Photo, here are some ways you can do so
Text Link
photo Link
<span class="text-link">
<span>
<a target="_blank" href=https://pikwizard.com/photo/digital-screen-displaying-stock-market-index-data-trends/6b31335dffdd4690c9273426dafbbe8a/>PikWizard</a>
</span>
</span>
<span class="image-link">
<span
style="margin: 0 0 20px 0; display: inline-block; vertical-align: middle; width: 100%;"
>
<a
target="_blank"
href="https://pikwizard.com/photo/digital-screen-displaying-stock-market-index-data-trends/6b31335dffdd4690c9273426dafbbe8a/"
style="text-decoration: none; font-size: 10px; margin: 0;"
>
<img src="https://pikwizard.com/pw/medium/6b31335dffdd4690c9273426dafbbe8a.jpg" style="margin: 0; width: 100%;" alt="" />
<p style="font-size: 12px; margin: 0;">PikWizard</p>
</a>
</span>
</span>
Free (free of charge)
Free for personal and commercial use.
Author: Authentic Images
Similar Free Stock Images

Premium


Premium


Premium


Premium


Premium


Premium


Premium


Premium


Premium


Premium


Premium


Premium


Premium


Premium


Premium


Premium


Premium


Premium


Premium


Premium


Premium


Premium


Premium


Premium