
- Home >
- Stock Photos >
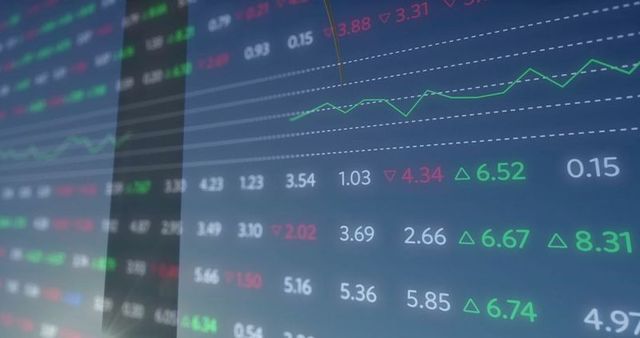
- Digital Screen Showing Financial Analytics Graphs and Data
Digital Screen Showing Financial Analytics Graphs and Data Image
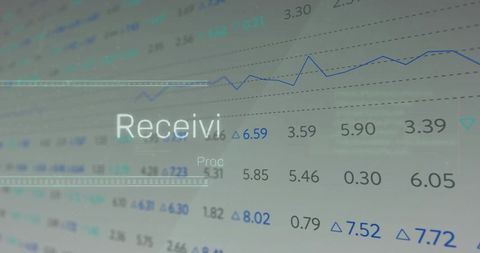
Digital display featuring financial analytics with a blue line graph and delta icons provides a dynamic view of business data. Useful for illustrating how modern technology aids decision-making through interactive visual data representation in settings such as finance-related articles, business technology showcases, or presentations on data analysis techniques.
Powered by 


downloads
Tags:
More
Credit Photo
If you would like to credit the Photo, here are some ways you can do so
Text Link
photo Link
<span class="text-link">
<span>
<a target="_blank" href=https://pikwizard.com/photo/digital-screen-showing-financial-analytics-graphs-and-data/ba4d9e5bbc0bf8710dc3c51fb87b43b9/>PikWizard</a>
</span>
</span>
<span class="image-link">
<span
style="margin: 0 0 20px 0; display: inline-block; vertical-align: middle; width: 100%;"
>
<a
target="_blank"
href="https://pikwizard.com/photo/digital-screen-showing-financial-analytics-graphs-and-data/ba4d9e5bbc0bf8710dc3c51fb87b43b9/"
style="text-decoration: none; font-size: 10px; margin: 0;"
>
<img src="https://pikwizard.com/pw/medium/ba4d9e5bbc0bf8710dc3c51fb87b43b9.jpg" style="margin: 0; width: 100%;" alt="" />
<p style="font-size: 12px; margin: 0;">PikWizard</p>
</a>
</span>
</span>
Free (free of charge)
Free for personal and commercial use.
Author: Authentic Images
Similar Free Stock Images

Premium


Premium


Premium


Premium


Premium


Premium


Premium


Premium

Premium


Premium


Premium


Premium


Premium


Premium


Premium


Premium


Premium


Premium

Premium


Premium


Premium


Premium


Premium


Premium

Premium


Explore More Free Stock Images