- Home >
- Stock Photos >
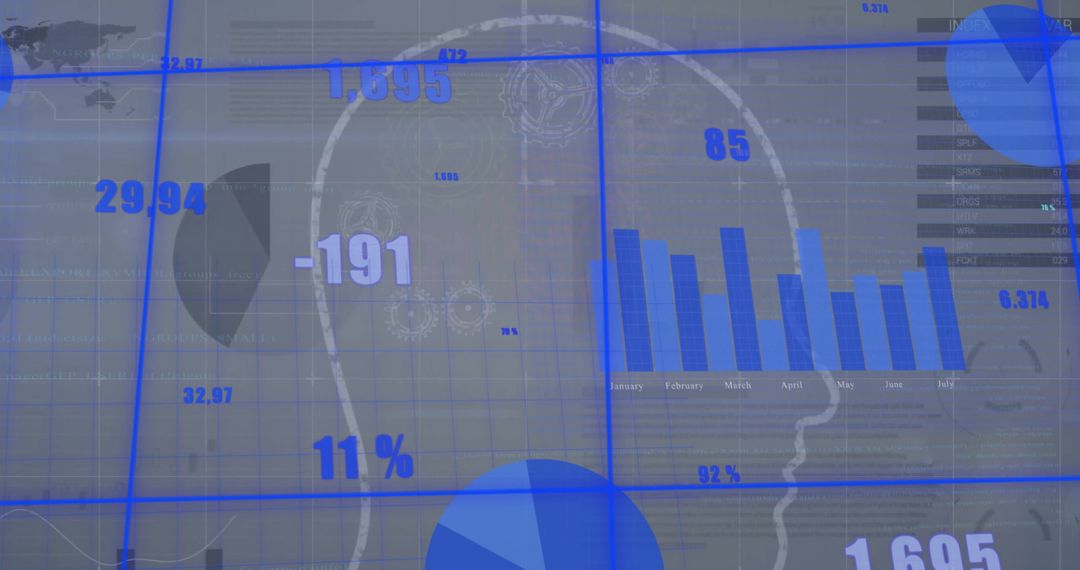
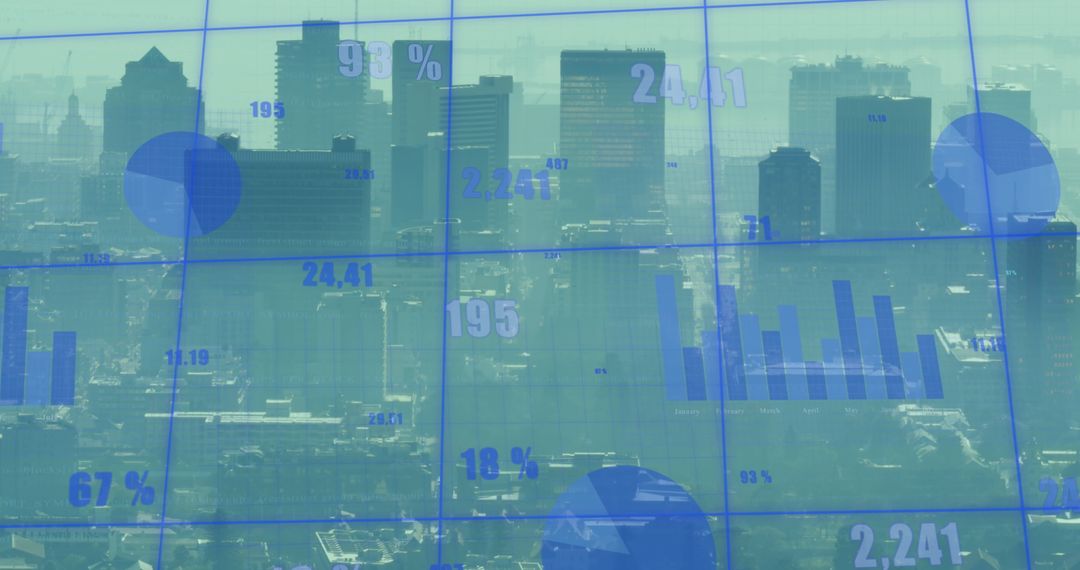
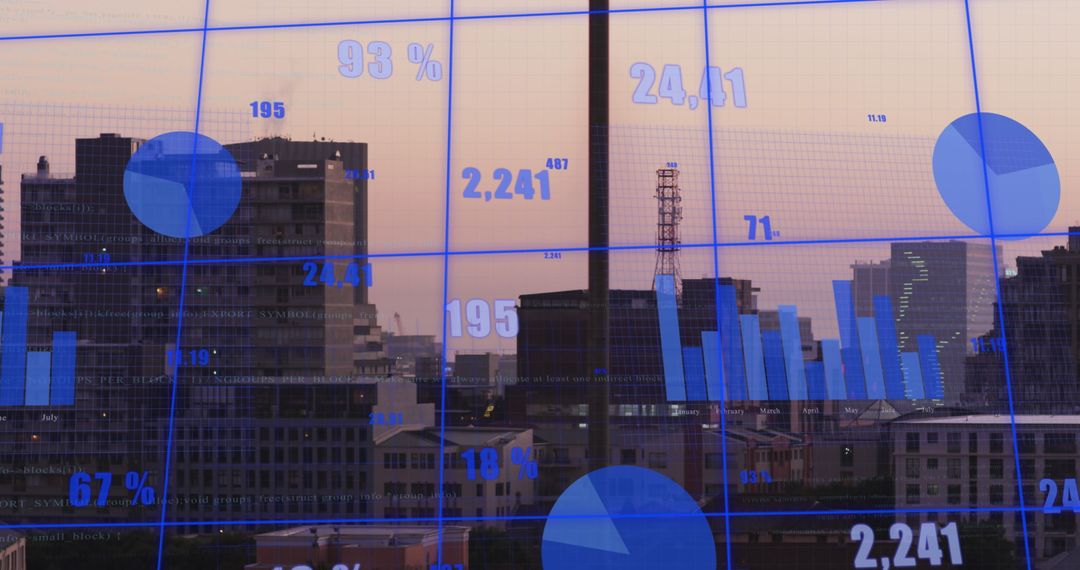
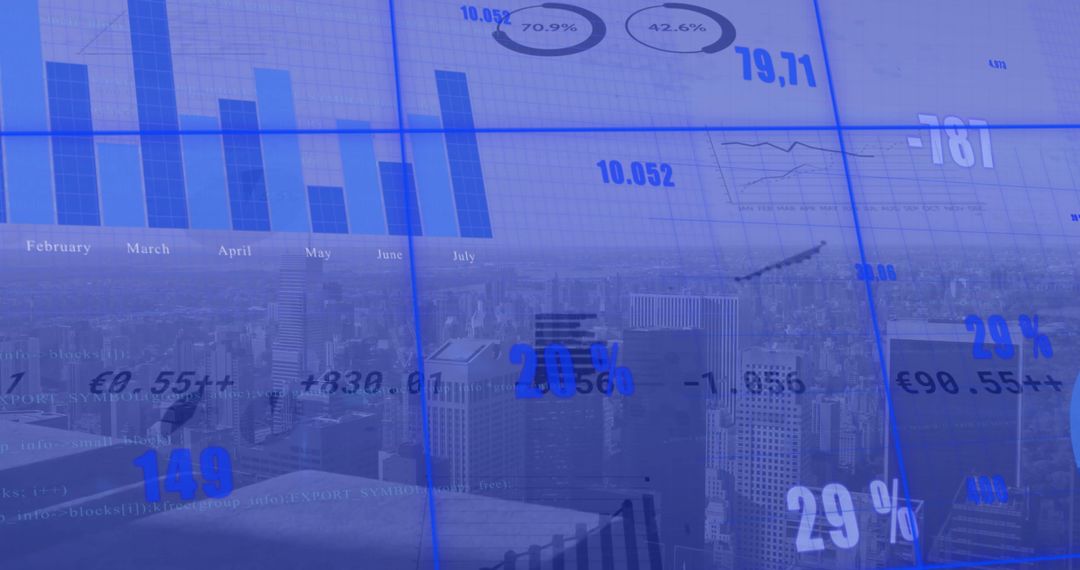
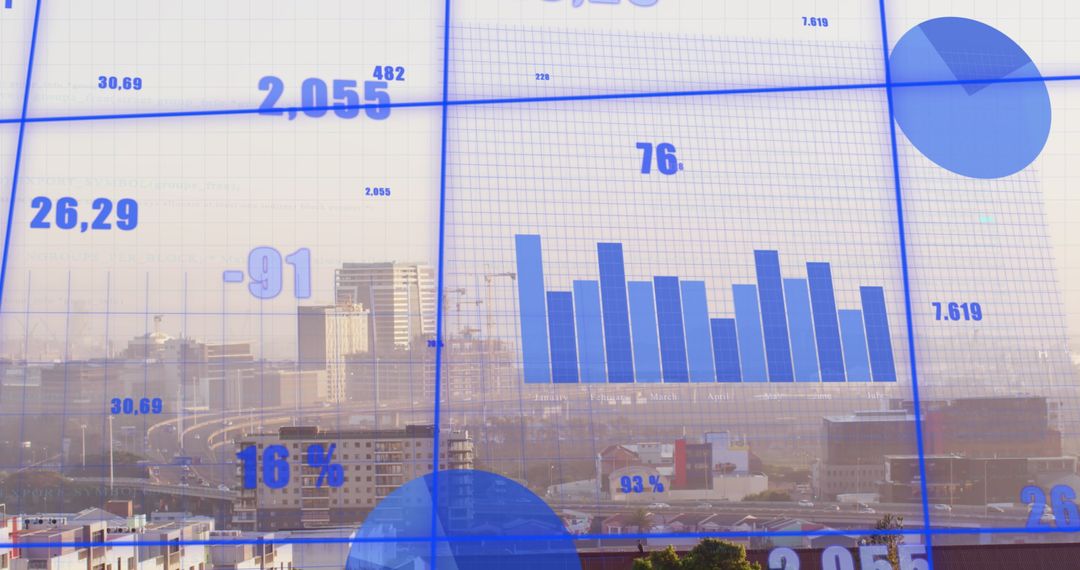
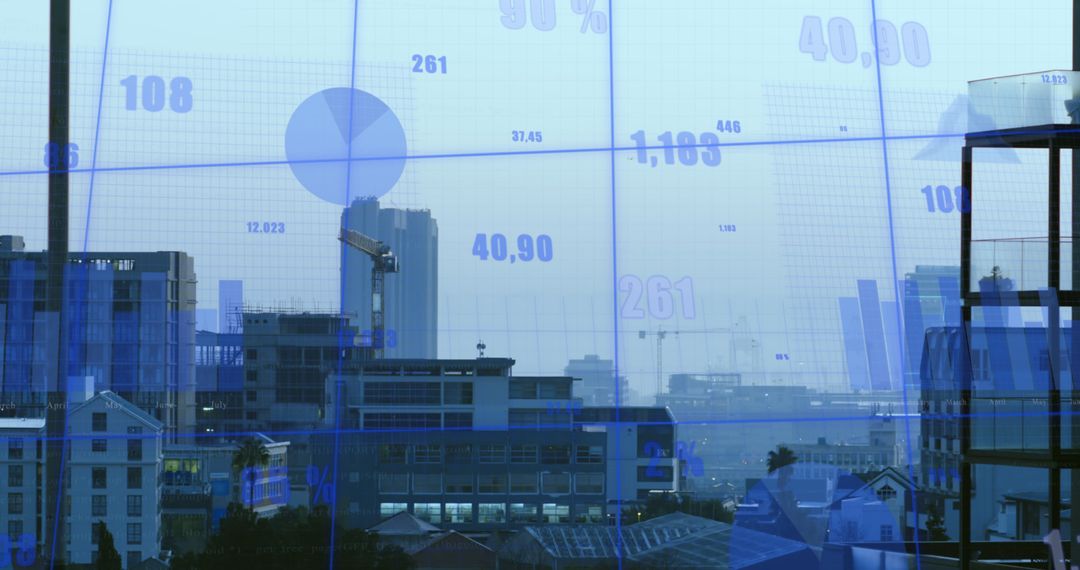
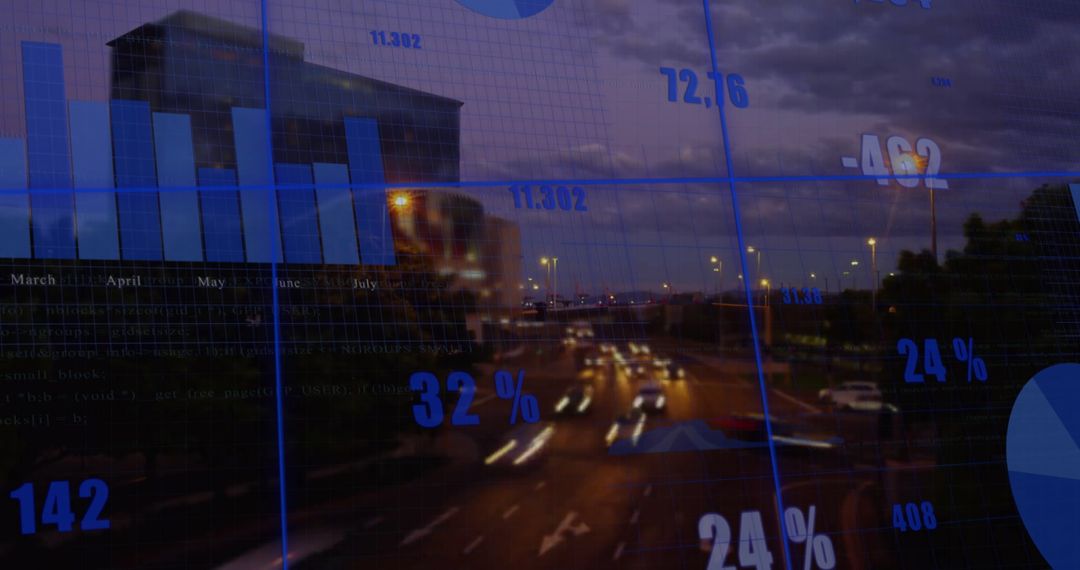
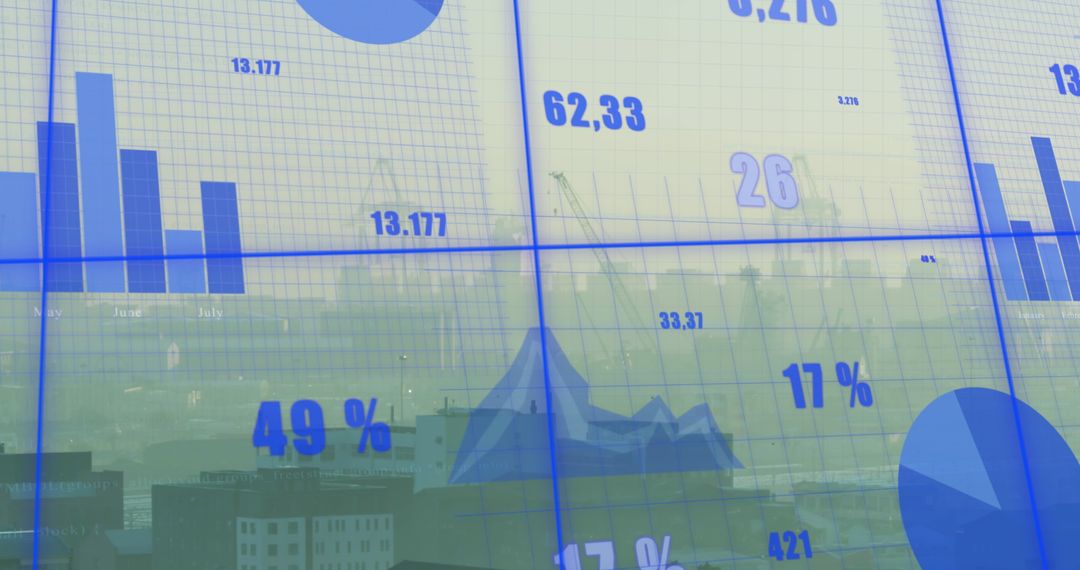
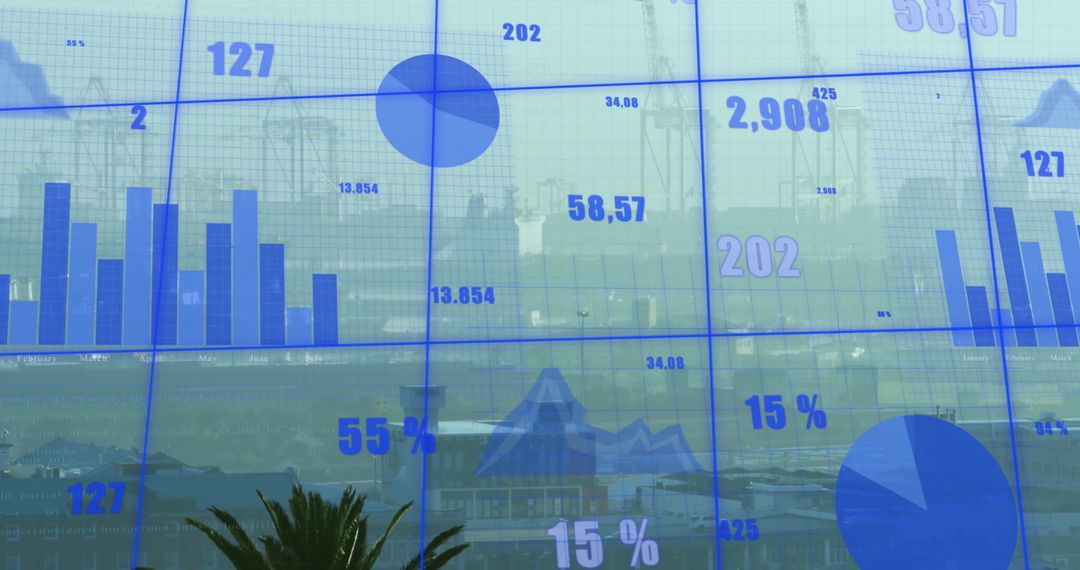
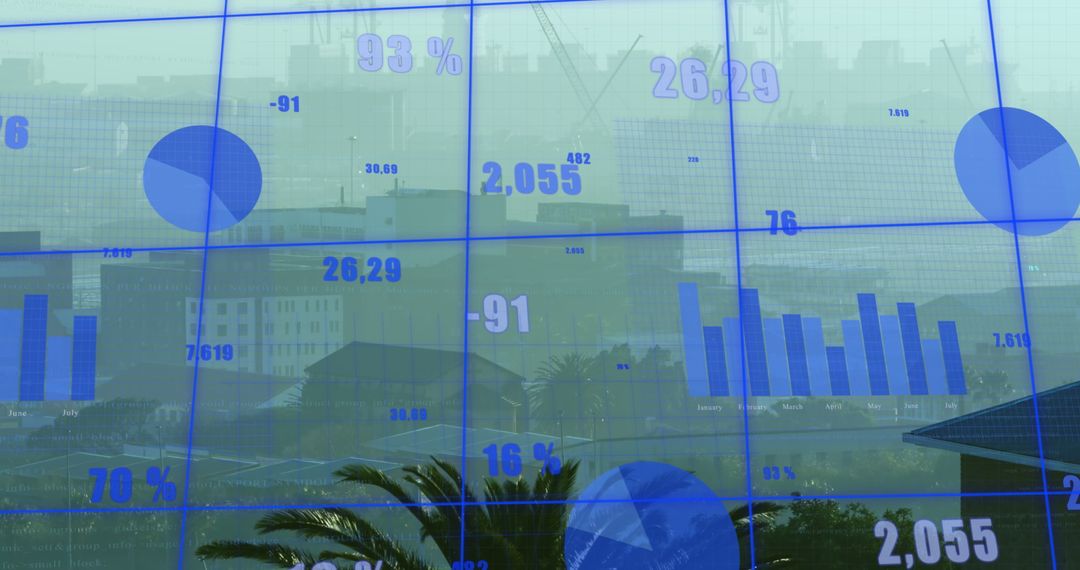
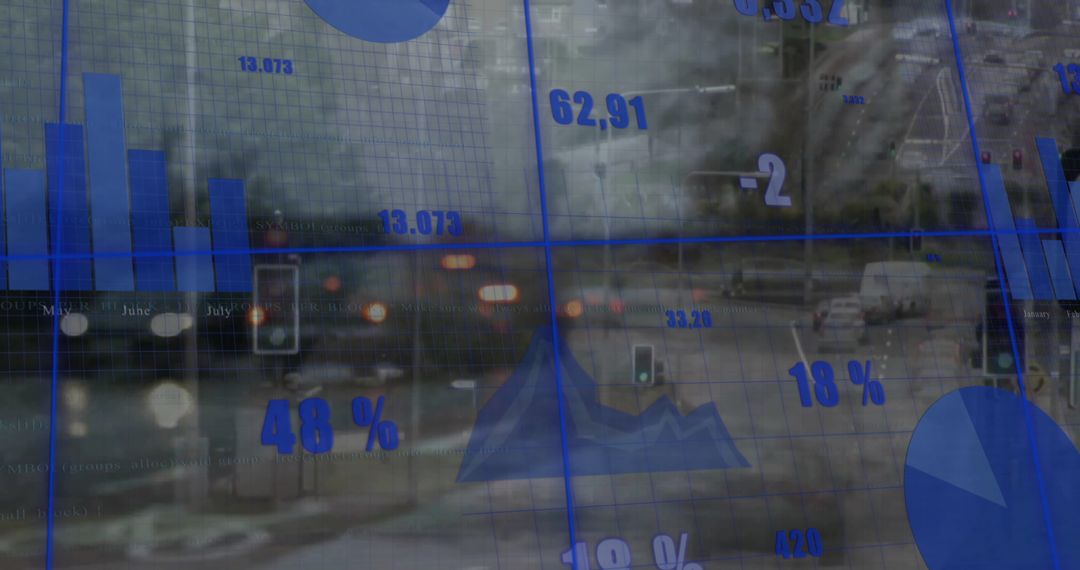
- Digital Screen with Business Graph Graphics Overlayed on Foggy Cityscape
Digital Screen with Business Graph Graphics Overlayed on Foggy Cityscape Image
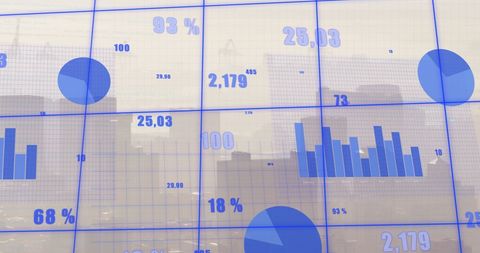
Visual of digital graphs and charts overlaid on fog-covered city suggests advanced data analysis. Ideal for illustrating economic growth, finance concepts, statistical reports. Suitable for presentations, business analysis content, or finance websites.
Powered by 


2
downloads
downloads
Tags:
More
Credit Photo
If you would like to credit the Photo, here are some ways you can do so
Text Link
photo Link
<span class="text-link">
<span>
<a target="_blank" href=https://pikwizard.com/photo/digital-screen-with-business-graph-graphics-overlayed-on-foggy-cityscape/1db47bcbfa8b702f9af8b2ab826bbf9e/>PikWizard</a>
</span>
</span>
<span class="image-link">
<span
style="margin: 0 0 20px 0; display: inline-block; vertical-align: middle; width: 100%;"
>
<a
target="_blank"
href="https://pikwizard.com/photo/digital-screen-with-business-graph-graphics-overlayed-on-foggy-cityscape/1db47bcbfa8b702f9af8b2ab826bbf9e/"
style="text-decoration: none; font-size: 10px; margin: 0;"
>
<img src="https://pikwizard.com/pw/medium/1db47bcbfa8b702f9af8b2ab826bbf9e.jpg" style="margin: 0; width: 100%;" alt="" />
<p style="font-size: 12px; margin: 0;">PikWizard</p>
</a>
</span>
</span>
Free (free of charge)
Free for personal and commercial use.
Author: Authentic Images
Similar Free Stock Images
Premium


Premium


Premium


Premium


Premium


Premium


Premium


Premium


Premium


Premium


Premium


Premium


Premium


Premium


Premium


Premium


Premium


Premium


Premium

Premium


Premium


Premium


Premium


Premium