1. Home > 
  2. Stock Photos > 
  3. Digital Security and Stock Market Data Visualization

Digital Security and Stock Market Data Visualization Image

Digital Security and Stock Market Data Visualization

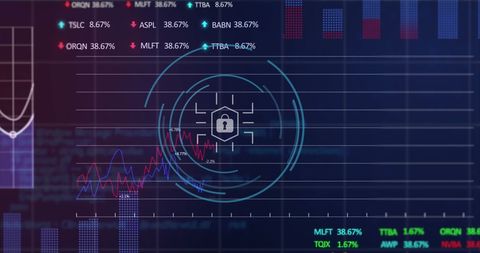
Scene features digital padlock symbol against backdrop of holographic graphs and trading data. Ideal for illustrating concepts of financial security, data protection, technology advancement, cybersecurity, and the intersection of stock market analytics and digital innovation. Useful for financial information platforms, tech blogs, security awareness campaigns, and investment strategy analysis.

Powered by Shutterstock logo - Get 15% off with code: PIKWIZARD15
Man look at the dashboard with graphs and charts. Concept of data management system, business intelligence, data statistics, marketing analysis, key performance indicators (KPI) and analytics. - Powered by Shutterstock - Get 15% off with code: PIKWIZARD15Man look at the dashboard with graphs and charts. Concept of data management system, business intelligence, data statistics, marketing analysis, key performance indicators (KPI) and analytics. - Powered by Shutterstock - Get 15% off with code: PIKWIZARD15Young Happy Businesswoman Using Laptop Computer in Modern Office with Colleagues. Stylish Beautiful Financial Advisor Working. VFX Hologram Edit Visualizing Stock Exchange Interface, Opened Charts. - Powered by Shutterstock - Get 15% off with code: PIKWIZARD15Interactive Data Visualization Professional Engages With Data Driven Marketing Insights For Global Business Intelligence, Utilizing Tablet Analysis World Map Visualization For Informed Decision-Making - Powered by Shutterstock - Get 15% off with code: PIKWIZARD15Data-Driven Investment Analyzing Financial Markets, Professional analyzing stock market data with advanced analytics through digital interfaces, highlighting importance of informed trading decisions - Powered by Shutterstock - Get 15% off with code: PIKWIZARD15

Credit Photo

If you would like to credit the Photo, here are some ways you can do so

Free (free of charge)

Free for personal and commercial use.

Author: Creative Art

Similar Free Stock Images

Dynamic Financial Data Display in Digital Space
Premium
Businesswoman using laptop in data management.
Dynamic Digital Data Analysis on Elevated Grid
Financial Data Graph Rendering Global Market Trends
Dynamic Line Chart with Histogram on Digital Grid Background
Rising Digital Graph and Data Visualizations on Black Background
Premium
Displaying yellow jagged stock chart running over banknote on trading screen, with glitch band. Currency, market, volatility, data, visualization, digital, overlay
Digital Financial Dashboard with Graphs and Data Visualization
Analyzing Accelerating Data Trends on Grid with Tech Insights
Optimized Statistical Data Overlain on Corporate Architecture
Digital Financial Data Analysis with Graphs and Stock Market Trends
Premium
"Mobile Investment and Finance Management: Analyzing Market Data and Trading on a Digital Smartphone Platform"
Dynamic Financial Growth Digital Chart Display
Digital Financial Data Graph Showcasing Market Trends
Abstract Digital Finance Chart Showing Fluctuating Graph Lines
Dynamic Business Data and Cityscape Visualization
Premium
Asia woman expert people AI deep tech talent working on project predict sales insight SEO graph chart plan visual big data science report center BI smart tools screen. Office worker asian analyst job.
Colorful Data Visualization on Dark Background
Futuristic Technology Interface with Digital Financial Graphs
Dynamic Financial Data Visualization on Digital Grid Background
Neon Round Scanner with Statistical Data Display
Premium
Collage of various business concepts. Wide angle visual for banners or advertisements.
Digital Financial Data and AI Illustration Networking Globally
Futuristic Globe and Code Background Display
Dynamic Financial Graphs Overlaying Modern Cityscape
Cityscape with Digital Stock Market Graphs and Statistics
Premium
Asia woman expert people AI deep tech talent working on project predict sales insight SEO graph chart plan visual big data science report center BI smart tools screen. Office worker asian analyst job.
Dynamic Financial Data Displays Stock Market Trends
Digital Visualization of Global Networking with Statistical Graphs
Futuristic Growth Hacking Data Analytics Concept
Futuristic Data Visualization with Dynamic Graphs and Digital Globe
Futuristic Digital Interface with DNA and Brain Diagrams
Financial Data Overlay on Cityscape Visualizing Market Trends
Premium
Visual business concept.Digital marketing and data analysis of financial.Economic business growth on global business network. Social networking service.
Financial Data Flow against Urban Skyline Backdrop
Falling Line Graph on Navy Background Illustrating Economic Decline
Futuristic Digital Interface with Spiraling Coding Patterns
Digital Finance: Modern Stock Market Analysis Display
Premium
Asia woman expert people AI deep tech talent working on project predict sales insight SEO graph chart plan visual big data science report center BI smart tools screen. Office worker asian analyst job.
Financial Data Line Graph on Digital Display
Futuristic Graph with Digital Globe Symbolizing Global Technology Connections
Data Trends and Analysis on 3D Digital Grid
Futuristic Digital Network Interface With Interactive Wave Patterns
Premium
Displaying multicolored bars, red turquoise line graphs on screen, with streaming binary digits. Data visualization, financial analytics, digital interface, cyber security, technology, futuristic,
Digital Financial Data Overlay on Urban Street Scene
Futuristic Financial and Technological Data Visualization Concept
Digital Stock Market Green Graph Against Dark Trading Board
Digital Data Visualization with Trend Lines and Percentage Changes
Premium
Image of stock market data processing over african american businessman walking down the stairs. Global economy and business networking technology concept
Rising Graph Line on Digital Green Grid Background
Abstract Digital Interface with Mathematical Equations and Graphs on Black Background
Digital Finance Analysis: Interactive Data Visualization on Screen
Holographic Financial Data Visualization with Stock Trends
Premium
Dynamic scene with hands typing on a keyboard in front of a dark screen displaying a stock market trading interface with candlestick charts and indicators.
Analyzing Financial Data on Digital World Map Background
Interactive Social Media Metrics Overlaid on Business Data Graph
Line Graph Illustrating Data Trend on Green Digital Background
Futuristic Graph and Data Technology Interface
Premium
A diverse team analyzes financial data on a modern workspace with visual aids like charts and graphs while using digital technology to drive business strategy. Trope
Digital Data Processing with Chart in Futuristic Interface
Futuristic Digital DNA Interface with Waveform Data Visualization
Futuristic Neon Green Data Visualization on Grid Background
Digital Stock Market Trends and Financial Growth Analysis
Digital Financial Data Overlaying City Skyline at Dusk
Digital Interface with Virtual Data Surging Across Connection Globes
Premium
Business global internet connection application technology and digital marketing, Financial and banking, Digital link tech, big data Hand holding virtual Global Internet connection metaverse
Digital Financial Data Analysis with Graph and HUD Interface
Dynamic Financial Data Processing with Futuristic Graphic Interface
Financial Data Charts in Shimmering Blue Digital Space
Digital Financial Display with Graphs and Data Analysis
Premium
Double exposure of businessman hands using tablet and technology global networking security information with innovation icon virtual screen, Digital and construction cranes on city blurred background.
Dynamic Data Graphs on Digital Interface Background
Dynamic Financial Charts and Graphs Indicating Market Trends
Futuristic Financial Data Visualization on Digital Interface
Digital Interface Showing Financial Data with Security Icon
Premium
Displaying candlestick and line charts on screen over code grid with alert, percentage labels. Financial analysis, cybersecurity, data visualization, digital interface, data security, technological,
Dynamic Financial Data Visualizations on Grid Interface
Financial Graphs Overlaying Shopping Bag Representation Economy
Futuristic Global Finance Chart with Rotating Globe Animation
Financial Growth Graph and Data Analytics Representation
Premium
Man using magnifying glass on phone with red warning signs and falling stock charts, digital futuristic style, dark background, concept of financial risk
Neon Digital Interface with Financial Data Analytics
Abstract Digital Charts with Social Media Metrics Rising
Data Visualization on Security Shield Interface for Cyber Security
Digital Data and Financial Charts on White Background
Premium
Asia woman expert people AI deep tech talent working on project predict sales insight SEO graph chart plan visual big data science report center BI smart tools screen. Office worker asian analyst job.
Dynamic Financial Graphs Overlaying Urban Skyline
Global Financial Data Processing with Abstract Graphs
Abstract Financial Data Processing and Analysis Interface
Digital Stock Market Graph Red Trendline on Green Background
Premium
Asia woman expert people AI deep tech talent working on project predict sales insight SEO graph chart plan visual big data science report center BI smart tools screen. Office worker asian analyst job.
Advanced Digital Dashboard with Rising Bar and Line Charts
Candlestick Chart Visualization with Indicators and Growth Highlight
Graph Lines Portraying Financial Data Trends
World Map with Falling Line Graphs Indicating Global Economic Decline
Financial Data Charts with World Map on Blue Digital Background
Data Recovery Progress Display on Digital Interface
Premium
Blurred abstract background of a financial expert reviewing stock market data. Ideal for fintech, economy, and corporate strategy visuals.
Data Analytics and Financial Growth Indicators
Financial Graph and Waves Representing Market Trends and Data
Fluctuating Digital Stock Market Data Chart
Digital Financial Data with Graph and Grid Patterns
Premium
Displaying fingerprint line scanning on security screen, with stock grid and candlestick chart. Cybersecurity, finance, digital, biometric, analytics, data visualization, control room
Analyzing Data Trends on Digital Graph Interface
Digital Financial Data Analysis with Infographics and Charts
European Market Data Overlay with EU Flag and Financial Graphs
Data Analytics Graphs on Digital Interface Background
Premium
Businessman using smart watch and stock market data online, Application technology and digital marketing concept.
Digital Data Analysis Interface with Graphs and Scope
Financial Data Processing with Rising Graphs
Abstract Data Visualization with Dynamic Charts and Graphs
Rising Financial Data Graph on Digital Grid Background
Premium
Trader utilizes smartphone to examine fluctuating stock market graphs and data trends during trading hours.
Futuristic Keyboard Analytics Display with Digital Graphs and Numbers
Digital Data Flow with Infographics Hologram
NFT Financial Data Visualization with Digital Graph Overlay
Financial Data Analysis and Digital Interface Concept
Premium
Chicago skyline at dusk with futuristic holographic stock market data overlay. Digital composite concept with vibrant blue and magenta tones. Double exposure
Dynamic Financial Data Overlaid on Grid Background
Dynamic Financial Data Chart Showing Trend Analysis
Digital Interface Visualizing DNA and Data Patterns
Futuristic Data Dashboard with Abstract Waveforms and Light Effects
Premium
An overlay of orange and red lines, resembling a stock market chart, suggests financial fluctuations and volatility.
Financial Growth Chart with Data Visualization Elements