
- Home >
- Stock Photos >
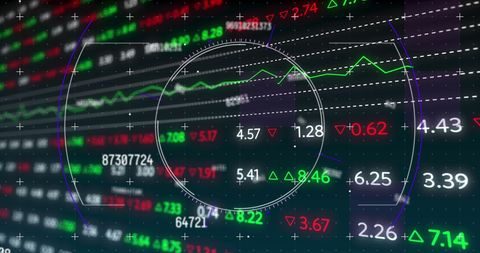
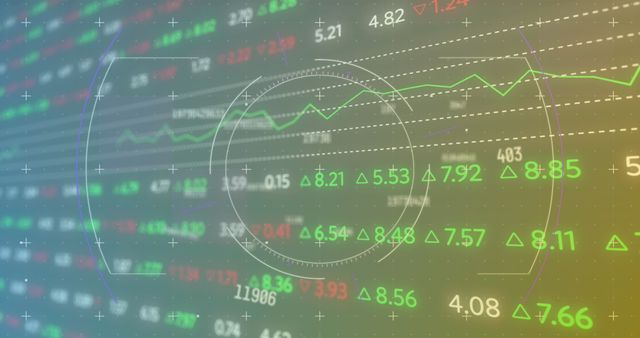
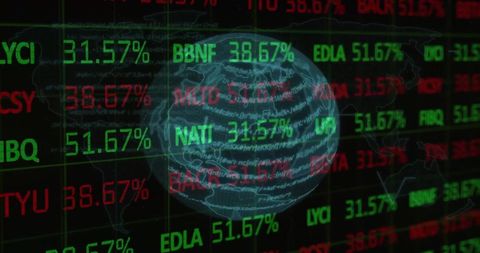
- Digital Security Interface Over Trading Display
Digital Security Interface Over Trading Display Image

This concept illustrates a digital interface combining technology and stock trading displays. Useful for themes on cybersecurity in financial markets, technological innovations in trading, or economic analysis. Ideal for articles, presentations, and educational materials on finance and data security benches.
Powered by 


downloads
Tags:
More
Credit Photo
If you would like to credit the Photo, here are some ways you can do so
Text Link
photo Link
<span class="text-link">
<span>
<a target="_blank" href=https://pikwizard.com/photo/digital-security-interface-over-trading-display/66a462f221793f133762819b7ee1e690/>PikWizard</a>
</span>
</span>
<span class="image-link">
<span
style="margin: 0 0 20px 0; display: inline-block; vertical-align: middle; width: 100%;"
>
<a
target="_blank"
href="https://pikwizard.com/photo/digital-security-interface-over-trading-display/66a462f221793f133762819b7ee1e690/"
style="text-decoration: none; font-size: 10px; margin: 0;"
>
<img src="https://pikwizard.com/pw/medium/66a462f221793f133762819b7ee1e690.jpg" style="margin: 0; width: 100%;" alt="" />
<p style="font-size: 12px; margin: 0;">PikWizard</p>
</a>
</span>
</span>
Free (free of charge)
Free for personal and commercial use.
Author: Authentic Images
Similar Free Stock Images

Premium


Premium


Premium


Premium


Premium


Premium


Premium


Premium

Premium


Premium


Premium


Premium


Premium


Premium


Premium


Premium


Premium


Premium


Premium


Premium


Premium


Premium

Premium


Premium


Premium


Explore More Free Stock Images