
- Home >
- Stock Photos >
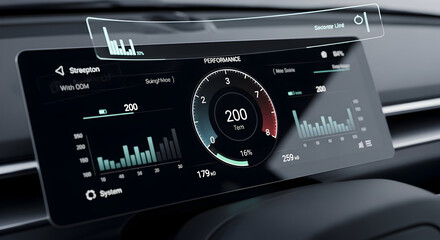
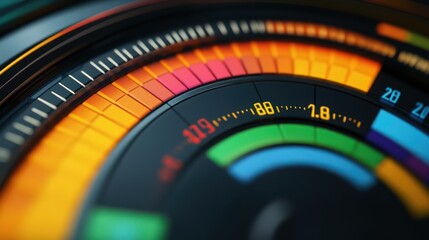
- Digital Speedometer and Data Visualization on Black Background
Digital Speedometer and Data Visualization on Black Background Image
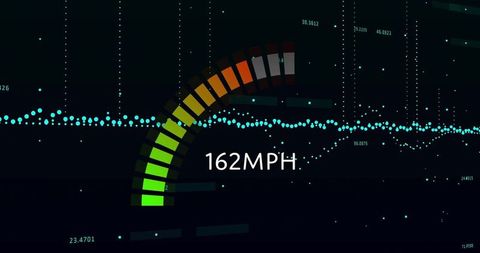
Illustrating technology with a speedometer and statistical data shimmering over a black matrix, this visual encapsulates the nexus of data analytics, global connections, and futuristic computing. Ideal for representing advanced digital solutions, technology presentations, and analytical infographics or dashboards, the dynamic representation captures rapid progress and innovation.
Powered by 


downloads
Tags:
More
Credit Photo
If you would like to credit the Photo, here are some ways you can do so
Text Link
photo Link
<span class="text-link">
<span>
<a target="_blank" href=https://pikwizard.com/photo/digital-speedometer-and-data-visualization-on-black-background/5193c0b76ff882cb62c72e3865649e52/>PikWizard</a>
</span>
</span>
<span class="image-link">
<span
style="margin: 0 0 20px 0; display: inline-block; vertical-align: middle; width: 100%;"
>
<a
target="_blank"
href="https://pikwizard.com/photo/digital-speedometer-and-data-visualization-on-black-background/5193c0b76ff882cb62c72e3865649e52/"
style="text-decoration: none; font-size: 10px; margin: 0;"
>
<img src="https://pikwizard.com/pw/medium/5193c0b76ff882cb62c72e3865649e52.jpg" style="margin: 0; width: 100%;" alt="" />
<p style="font-size: 12px; margin: 0;">PikWizard</p>
</a>
</span>
</span>
Free (free of charge)
Free for personal and commercial use.
Author: Creative Art
Similar Free Stock Images

Premium

Premium

Premium


Premium


Premium

Premium


Premium


Premium


Premium


Premium

Premium

Premium


Premium


Premium


Premium


Premium

Premium


Premium


Premium


Premium


Premium


Premium


Premium
Premium

Premium


Explore More Free Stock Images