
- Home >
- Stock Photos >
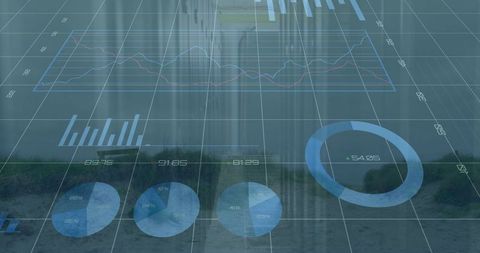
- Digital Speedometer with Data Graphs on Black Background
Digital Speedometer with Data Graphs on Black Background Image

This image features a digital speedometer alongside various data graphs on a sleek black digital interface, projecting a sense of futuristic technology and data analytics. Ideal for use in automotive technology presentations and articles, business insights, or any media needing a modern high-tech appearance.
Powered by 


downloads
Tags:
More
Credit Photo
If you would like to credit the Photo, here are some ways you can do so
Text Link
photo Link
<span class="text-link">
<span>
<a target="_blank" href=https://pikwizard.com/photo/digital-speedometer-with-data-graphs-on-black-background/858f66e8d9ce01b732c4628290b796de/>PikWizard</a>
</span>
</span>
<span class="image-link">
<span
style="margin: 0 0 20px 0; display: inline-block; vertical-align: middle; width: 100%;"
>
<a
target="_blank"
href="https://pikwizard.com/photo/digital-speedometer-with-data-graphs-on-black-background/858f66e8d9ce01b732c4628290b796de/"
style="text-decoration: none; font-size: 10px; margin: 0;"
>
<img src="https://pikwizard.com/pw/medium/858f66e8d9ce01b732c4628290b796de.jpg" style="margin: 0; width: 100%;" alt="" />
<p style="font-size: 12px; margin: 0;">PikWizard</p>
</a>
</span>
</span>
Free (free of charge)
Free for personal and commercial use.
Author: Creative Art
Similar Free Stock Images

Premium


Premium


Premium


Premium


Premium


Premium

Premium


Premium


Premium

Premium


Premium

Premium


Premium

Premium


Premium


Premium

Premium

Premium


Premium


Premium


Premium


Premium


Premium


Premium


Premium

Explore More Free Stock Images