
- Home >
- Stock Photos >
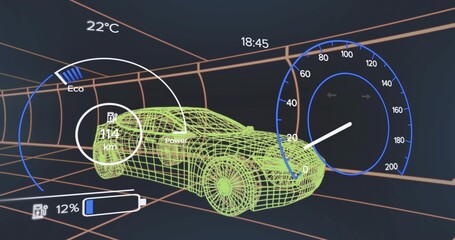
- Digital Speedometer with Network Evolution Needles on Technological Grid
Digital Speedometer with Network Evolution Needles on Technological Grid Image
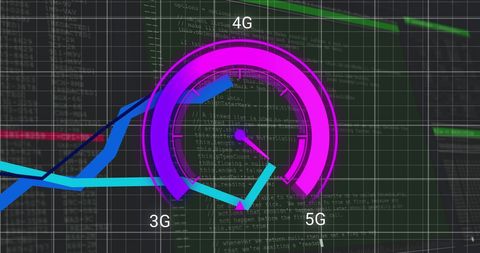
Illustration showcasing a speedometer display overlaid with digital coding and data processing elements, representing technological advances from 3G to 5G networks. Ideal for use in presentations about technology evolution, telecommunications, and digital transformation. Useful as visual support for discussions on internet speed advancements and global business technology strategies.
Powered by 


downloads
Tags:
More
Credit Photo
If you would like to credit the Photo, here are some ways you can do so
Text Link
photo Link
<span class="text-link">
<span>
<a target="_blank" href=https://pikwizard.com/photo/digital-speedometer-with-network-evolution-needles-on-technological-grid/e600f5ff2839fc0b672f9e27875641d1/>PikWizard</a>
</span>
</span>
<span class="image-link">
<span
style="margin: 0 0 20px 0; display: inline-block; vertical-align: middle; width: 100%;"
>
<a
target="_blank"
href="https://pikwizard.com/photo/digital-speedometer-with-network-evolution-needles-on-technological-grid/e600f5ff2839fc0b672f9e27875641d1/"
style="text-decoration: none; font-size: 10px; margin: 0;"
>
<img src="https://pikwizard.com/pw/medium/e600f5ff2839fc0b672f9e27875641d1.jpg" style="margin: 0; width: 100%;" alt="" />
<p style="font-size: 12px; margin: 0;">PikWizard</p>
</a>
</span>
</span>
Free (free of charge)
Free for personal and commercial use.
Author: Awesome Content
Similar Free Stock Images

Premium


Premium

Premium


Premium


Premium


Premium


Premium


Premium


Premium

Premium


Premium


Premium


Premium


Premium


Premium


Premium


Premium


Premium

Premium
Premium


Premium


Premium

Premium


Premium

Premium


Explore More Free Stock Images