
- Home >
- Stock Photos >
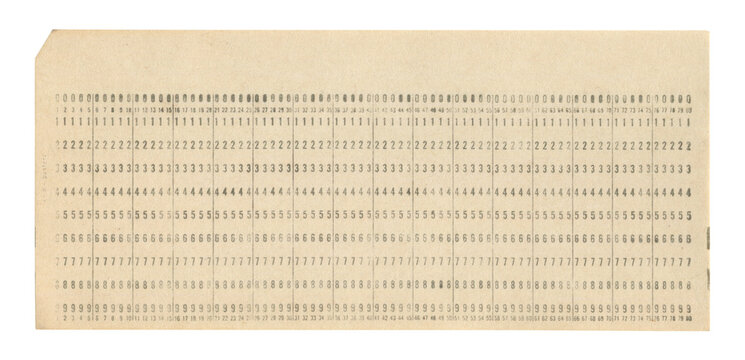
- Digital Statistical Data Interface with Mathematics Overlays
Digital Statistical Data Interface with Mathematics Overlays Image

Concept of digital data analysis combines mathematical equations and statistical data in sleek, technical design. Useful for illustrating science, technology, and education topics in presentations, academic articles, and business reports on data analysis and technology innovations.
Powered by 


downloads
Tags:
More
Credit Photo
If you would like to credit the Photo, here are some ways you can do so
Text Link
photo Link
<span class="text-link">
<span>
<a target="_blank" href=https://pikwizard.com/photo/digital-statistical-data-interface-with-mathematics-overlays/8e7affd496ee09183c266781fe5d000e/>PikWizard</a>
</span>
</span>
<span class="image-link">
<span
style="margin: 0 0 20px 0; display: inline-block; vertical-align: middle; width: 100%;"
>
<a
target="_blank"
href="https://pikwizard.com/photo/digital-statistical-data-interface-with-mathematics-overlays/8e7affd496ee09183c266781fe5d000e/"
style="text-decoration: none; font-size: 10px; margin: 0;"
>
<img src="https://pikwizard.com/pw/medium/8e7affd496ee09183c266781fe5d000e.jpg" style="margin: 0; width: 100%;" alt="" />
<p style="font-size: 12px; margin: 0;">PikWizard</p>
</a>
</span>
</span>
Free (free of charge)
Free for personal and commercial use.
Author: People Creations
Similar Free Stock Images

Premium


Premium

Premium


Premium


Premium


Premium


Premium

Premium

Premium

Premium


Premium


Premium


Premium

Premium


Premium


Premium


Premium


Premium


Premium

Premium


Premium


Premium

Premium


Premium


Premium

Explore More Free Stock Images