- Home >
- Stock Photos >
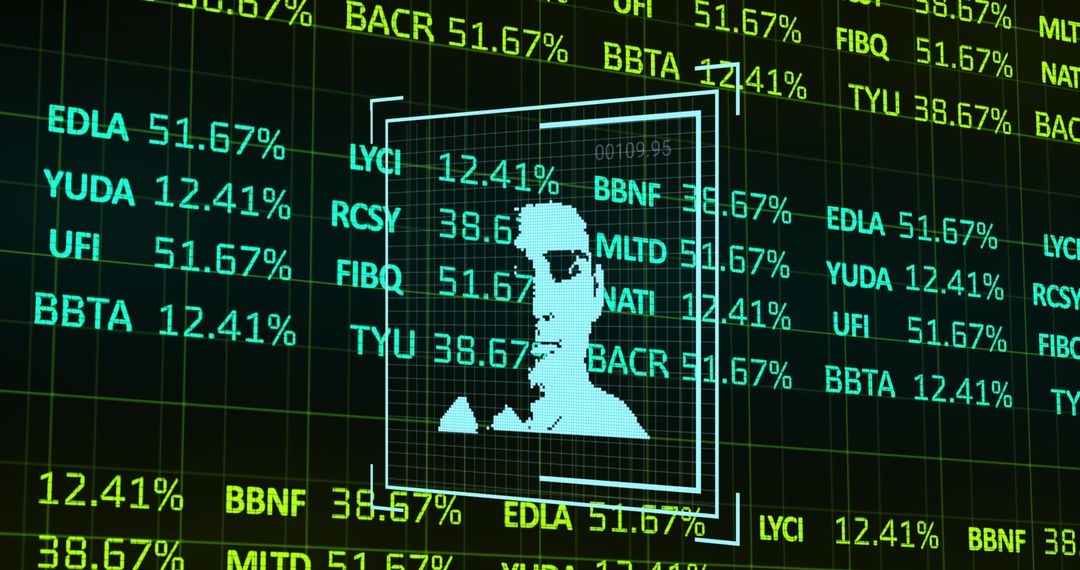
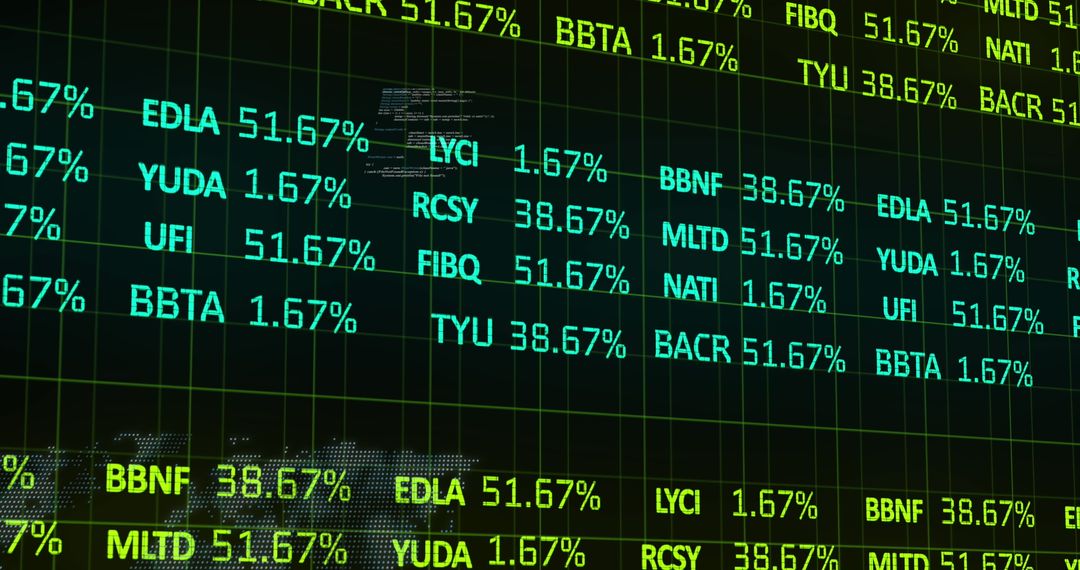
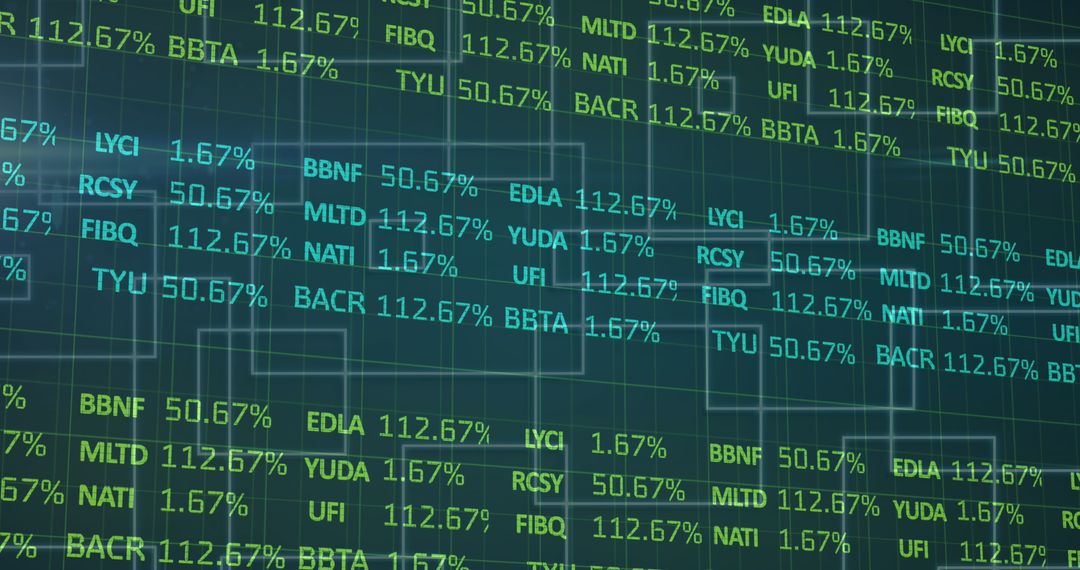
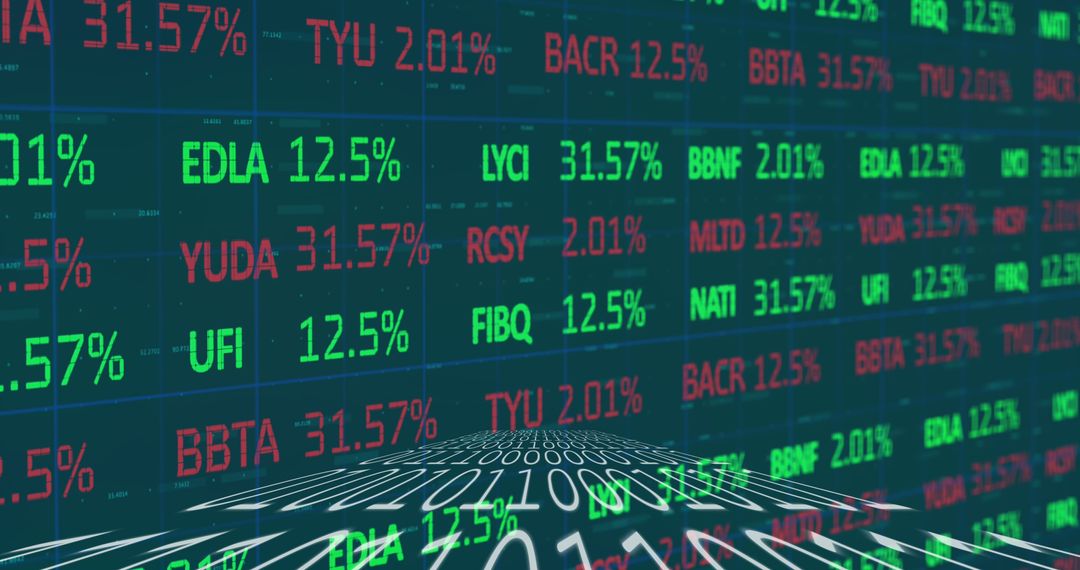
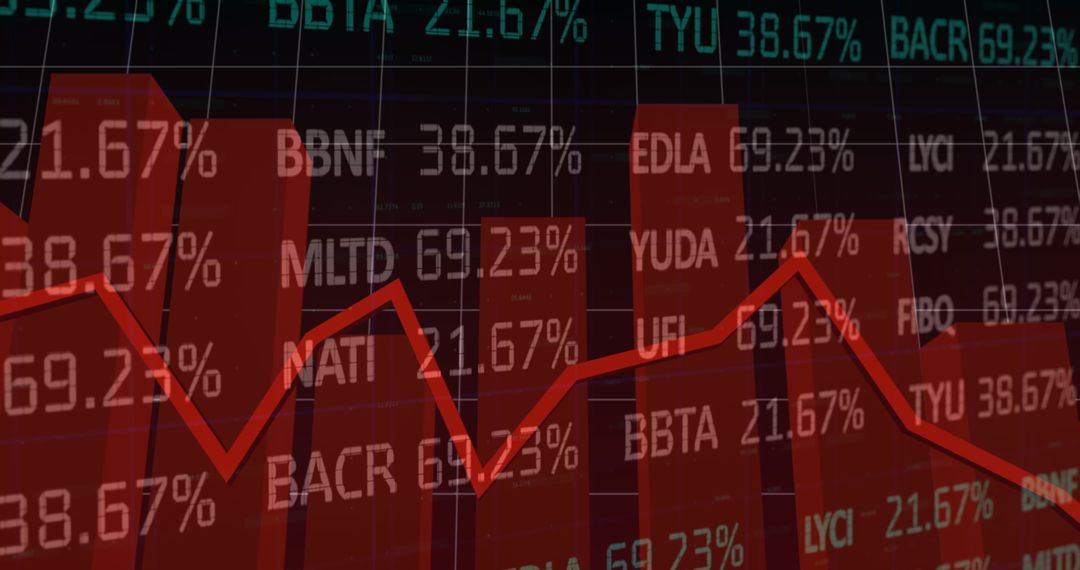
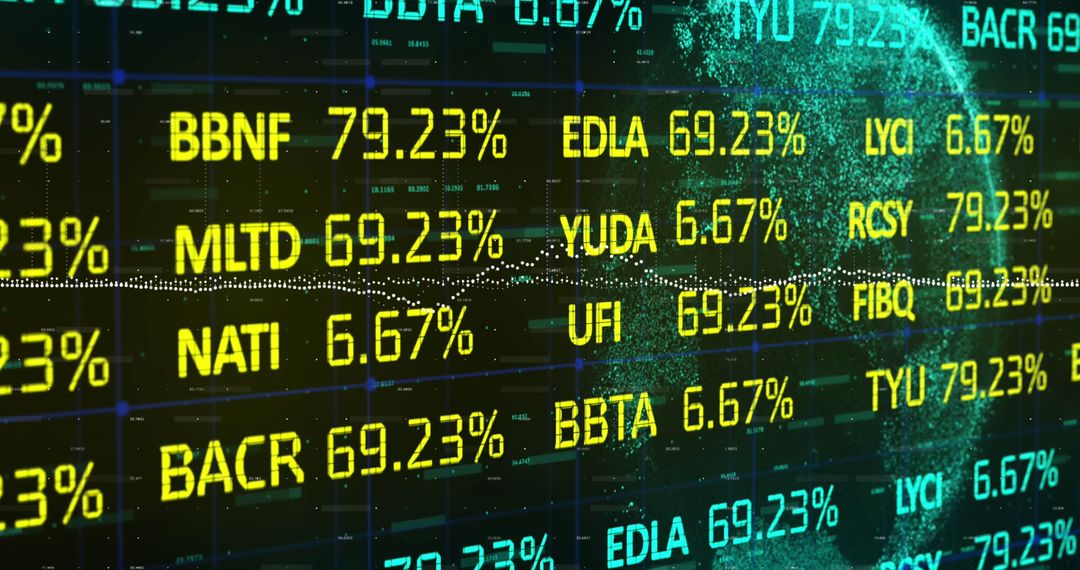
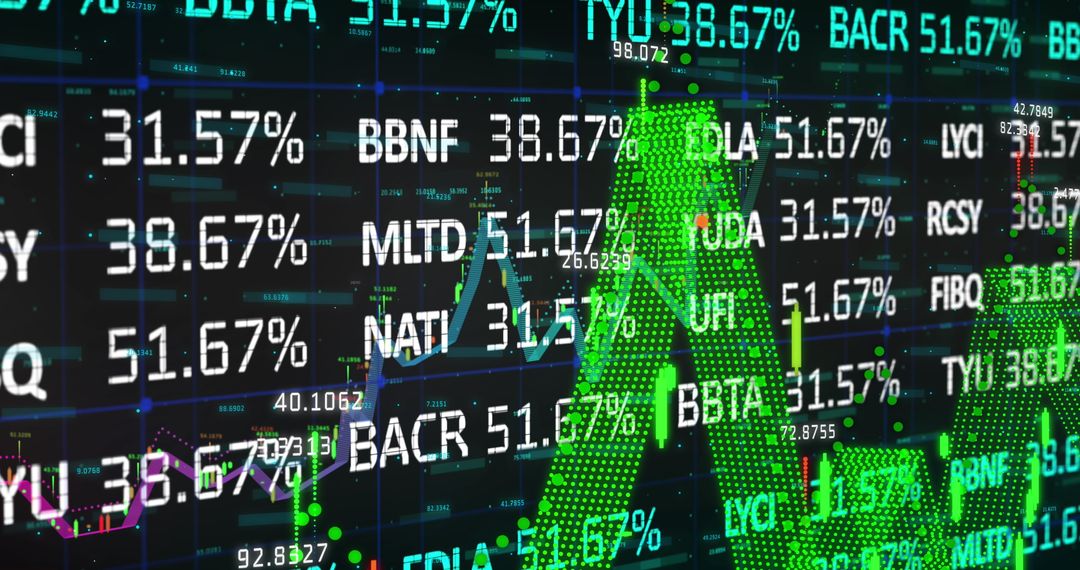
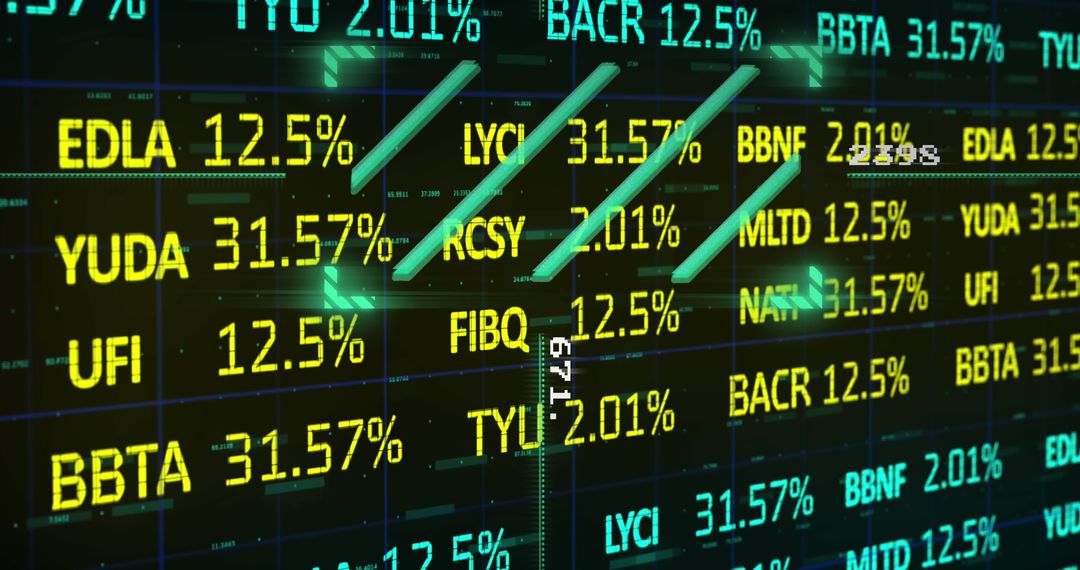
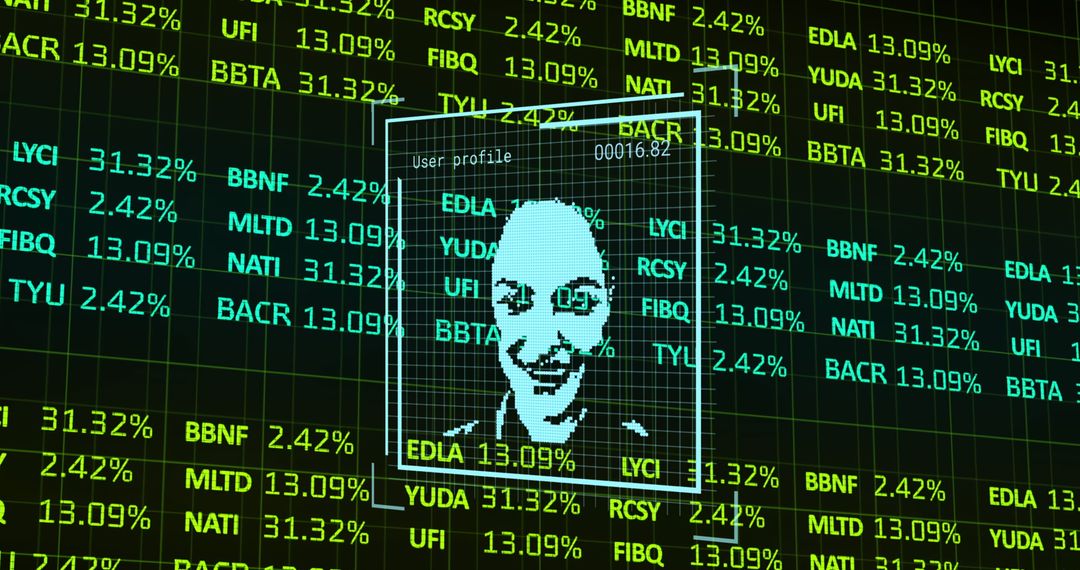
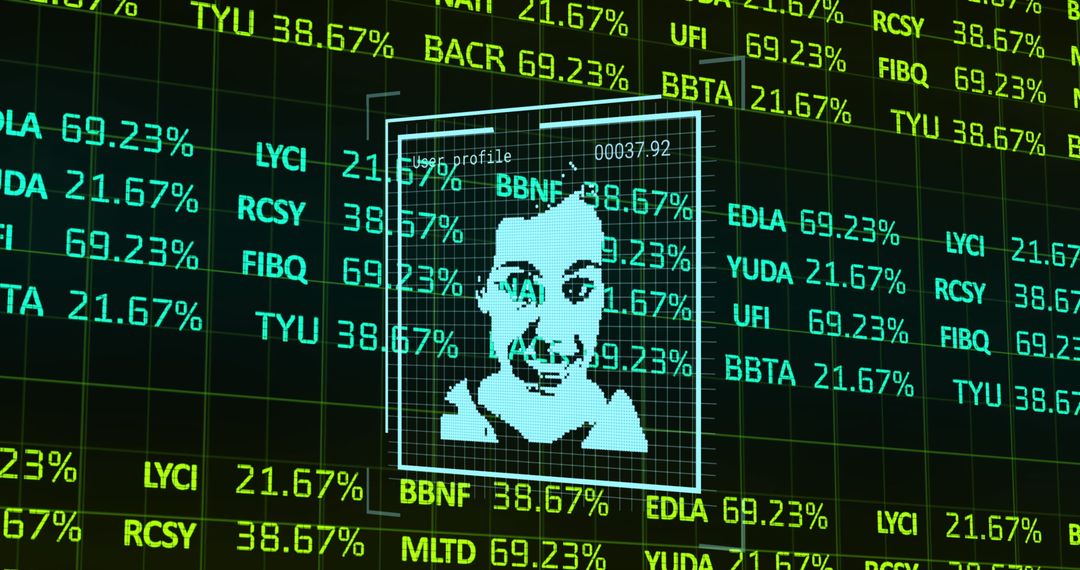
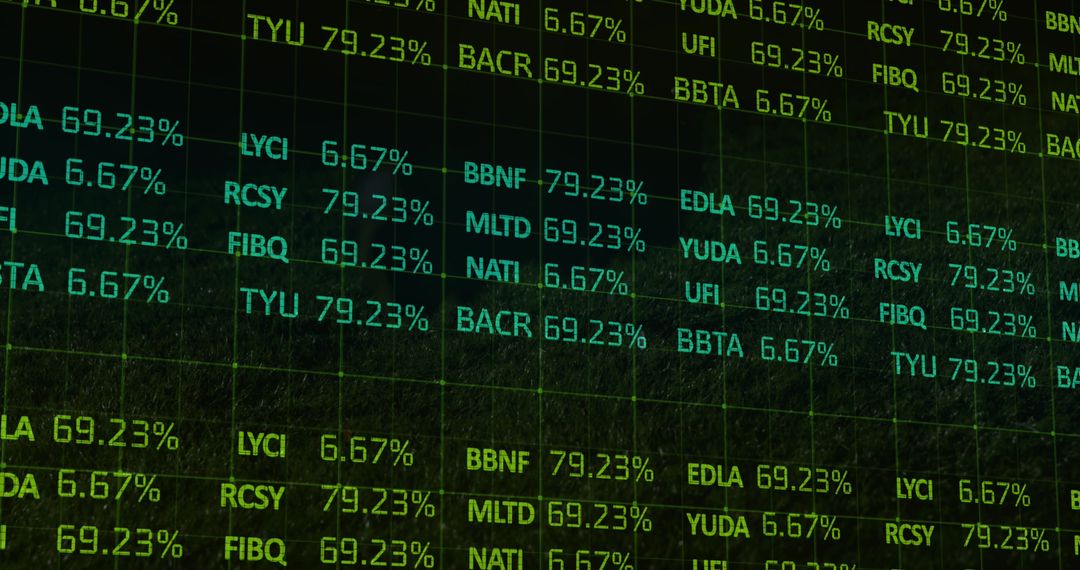
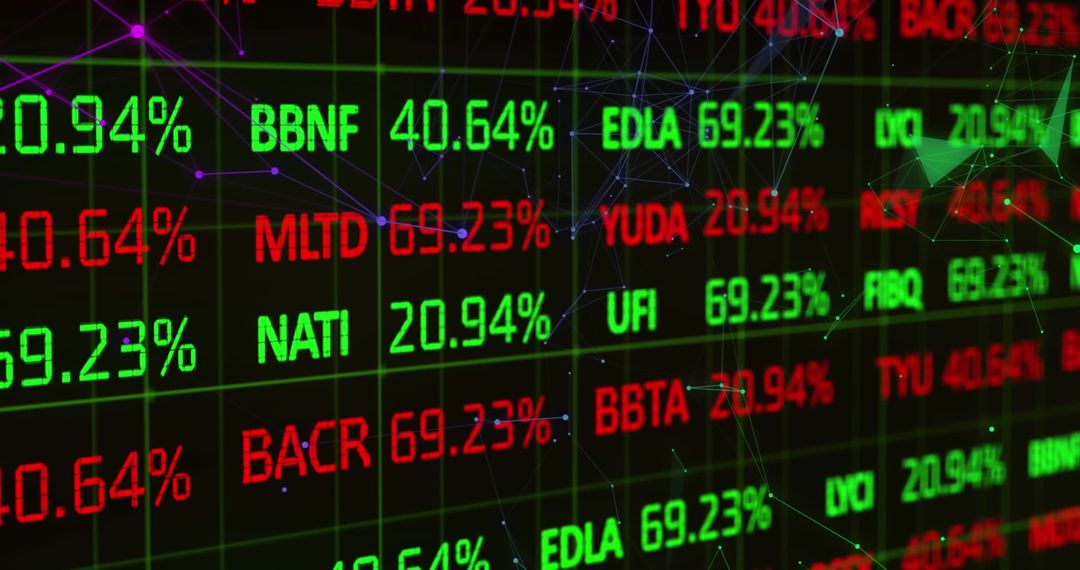
- Digital stock dashboard showing tickers, bar charts and red downward arrow for finance
Digital stock dashboard showing tickers, bar charts and red downward arrow for finance Image
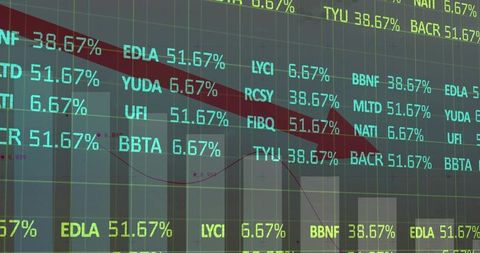
Showing digital stock dashboard with repeating ticker symbols, percentage labels, bar charts and red downward arrow, conveying market decline and data-driven urgency. Ideal for illustrating market analysis, investment risk, trading performance, financial news, economic reports, fintech product pages, data visualization case studies. Working well as website hero, blog header, presentation slide, social media post, newsletter banner, or advertising creative. Allowing easy overlay of headline and call-to-action due to negative space on upper-right area. Color palette featuring teal numeric text and red accent arrow, providing modern technology mood and clear visual contrast for editorial and marketing use.
Powered by  - Get 15% off with code: PIKWIZARD15


0
downloads
downloads
Tags:
More
Credit Photo
If you would like to credit the Photo, here are some ways you can do so
Text Link
photo Link
<span class="text-link">
<span>
<a target="_blank" href=https://pikwizard.com/photo/digital-stock-dashboard-showing-tickers-bar-charts-and-red-downward-arrow-for-finance/ffa115b2ce40b5fab487b77336f53285/>PikWizard</a>
</span>
</span>
<span class="image-link">
<span
style="margin: 0 0 20px 0; display: inline-block; vertical-align: middle; width: 100%;"
>
<a
target="_blank"
href="https://pikwizard.com/photo/digital-stock-dashboard-showing-tickers-bar-charts-and-red-downward-arrow-for-finance/ffa115b2ce40b5fab487b77336f53285/"
style="text-decoration: none; font-size: 10px; margin: 0;"
>
<img src="https://pikwizard.com/pw/medium/ffa115b2ce40b5fab487b77336f53285.jpg" style="margin: 0; width: 100%;" alt="" />
<p style="font-size: 12px; margin: 0;">PikWizard</p>
</a>
</span>
</span>
Free (free of charge)
Free for personal and commercial use.
Author: People Creations
Similar Free Stock Images
Premium


Premium


Premium


Premium


Premium


Premium


Premium


Premium


Premium


Premium


Premium


Premium


Premium


Premium


Premium


Premium


Premium


Premium


Premium

Premium


Premium


Premium


Premium


Premium