- Home >
- Stock Photos >
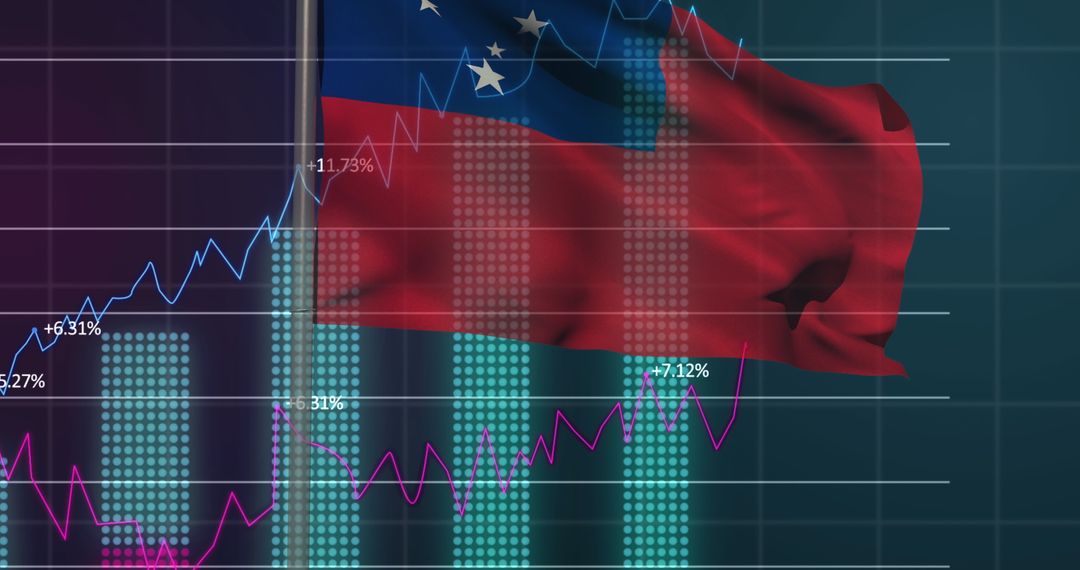
- Digital Stock Dashboard with Purple Line Graph and Tickers
Digital Stock Dashboard with Purple Line Graph and Tickers Image
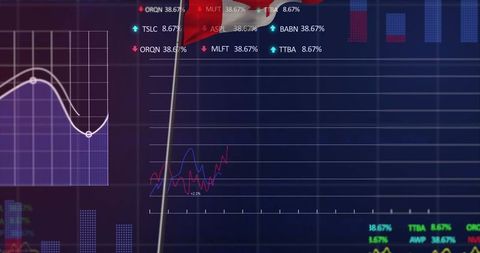
The image illustrates a digital stock dashboard showcasing a dynamic purple line graph with markers indicating data points, accompanied by financial tickers. This visualization represents market trends and electronic data analytics, crucial for monitoring stock performance or financial analysis. Useful for content related to finance, technology-driven analytics, investment analysis, and presentations on financial trends or tools.
Powered by  - Get 15% off with code: PIKWIZARD15


2
downloads
downloads
Tags:
More
Credit Photo
If you would like to credit the Photo, here are some ways you can do so
Text Link
photo Link
<span class="text-link">
<span>
<a target="_blank" href=https://pikwizard.com/photo/digital-stock-dashboard-with-purple-line-graph-and-tickers/93f6dc07fe2edc04475aea5f60e80e94/>PikWizard</a>
</span>
</span>
<span class="image-link">
<span
style="margin: 0 0 20px 0; display: inline-block; vertical-align: middle; width: 100%;"
>
<a
target="_blank"
href="https://pikwizard.com/photo/digital-stock-dashboard-with-purple-line-graph-and-tickers/93f6dc07fe2edc04475aea5f60e80e94/"
style="text-decoration: none; font-size: 10px; margin: 0;"
>
<img src="https://pikwizard.com/pw/medium/93f6dc07fe2edc04475aea5f60e80e94.jpg" style="margin: 0; width: 100%;" alt="" />
<p style="font-size: 12px; margin: 0;">PikWizard</p>
</a>
</span>
</span>
Free (free of charge)
Free for personal and commercial use.
Author: Authentic Images
Similar Free Stock Images

Premium


Premium


Premium


Premium


Premium


Premium


Premium


Premium


Premium


Premium


Premium


Premium


Premium


Premium


Premium


Premium


Premium


Premium


Premium


Premium


Premium


Premium


Premium


Premium