1. Home > 
  2. Stock Photos > 
  3. Digital Stock Dashboard with Tickers and Visualization

Digital Stock Dashboard with Tickers and Visualization Image

Digital Stock Dashboard with Tickers and Visualization

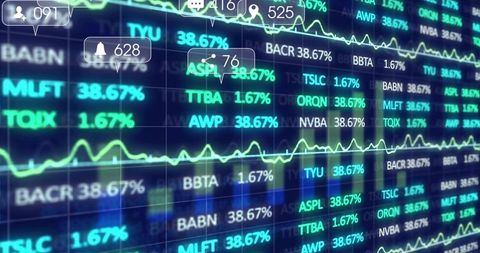
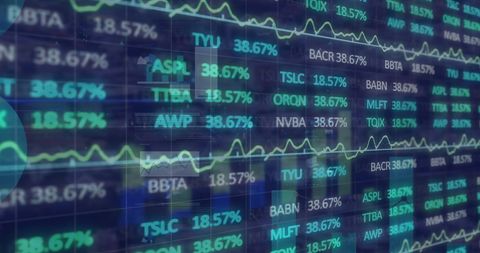
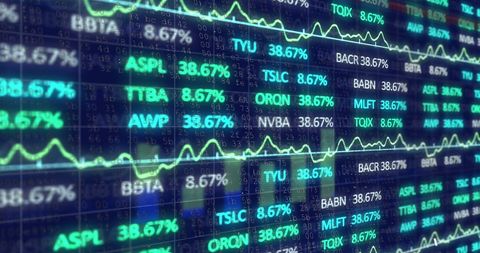
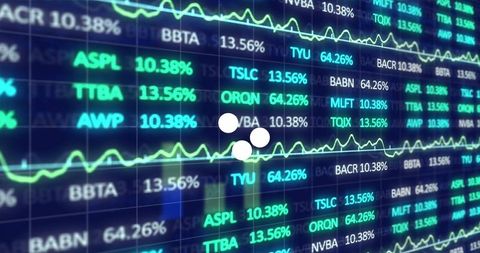
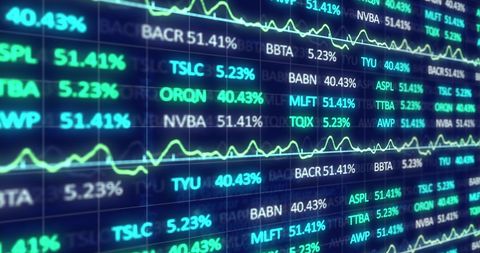
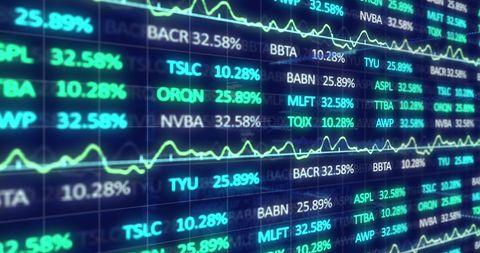
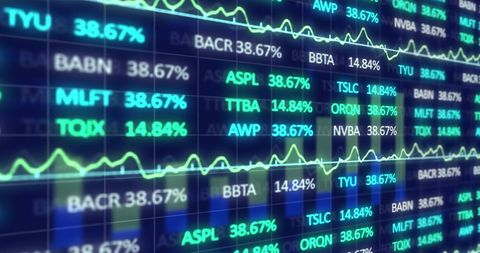
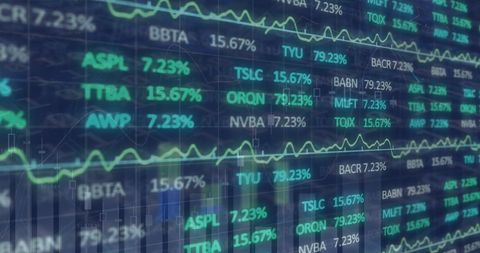
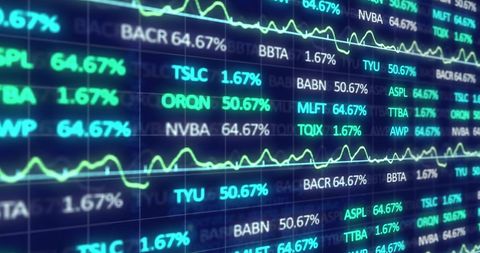
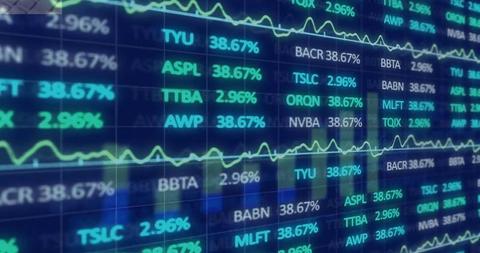
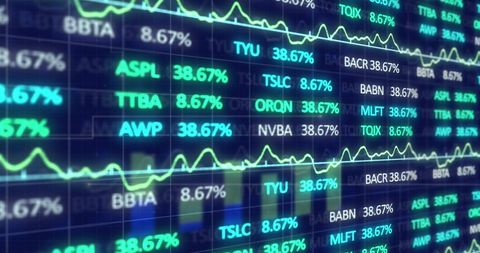
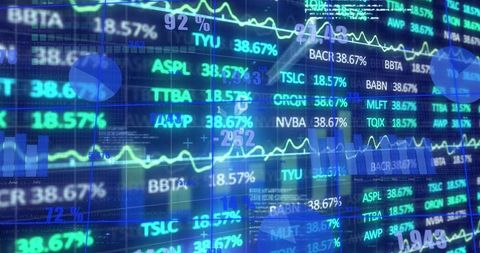
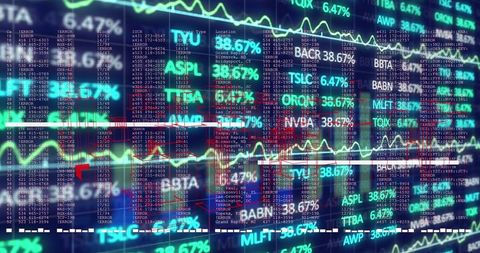
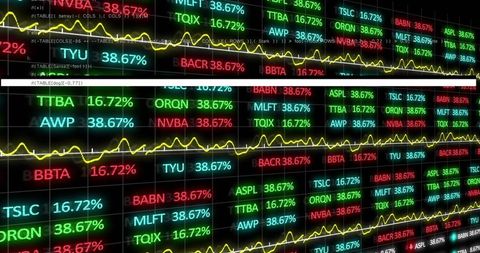
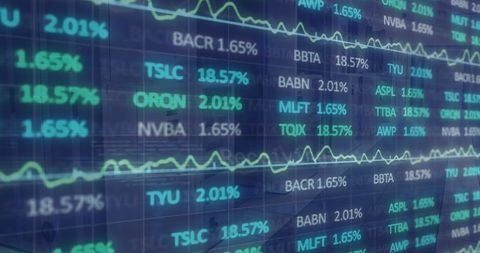
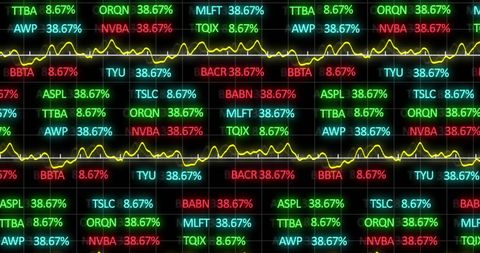
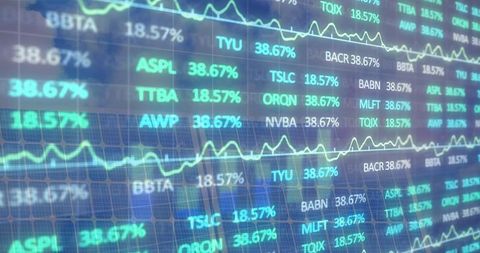
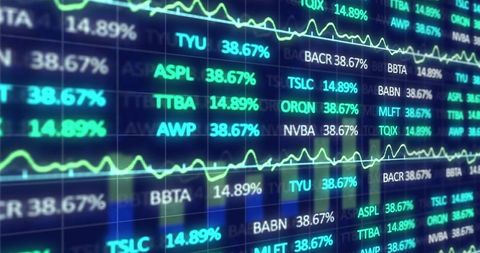
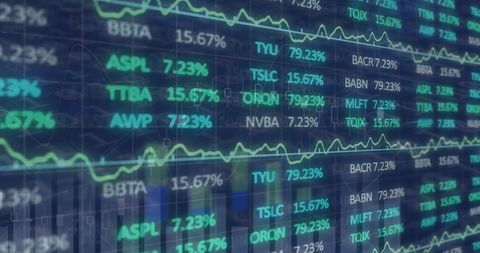
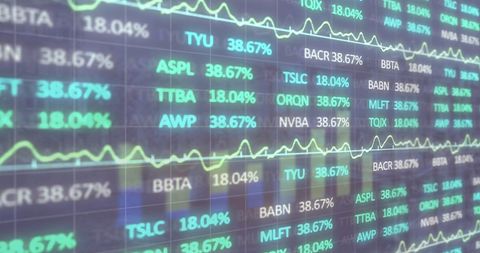
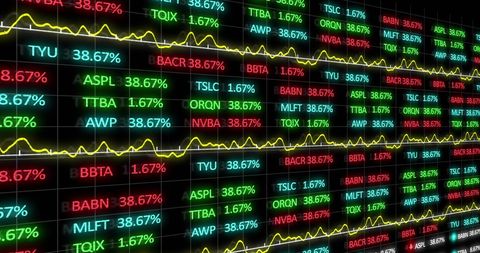
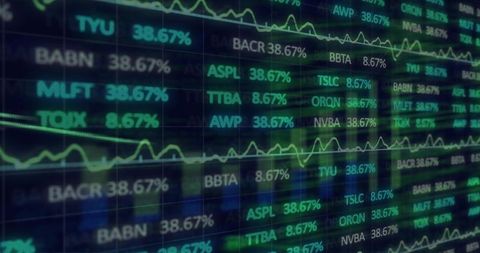
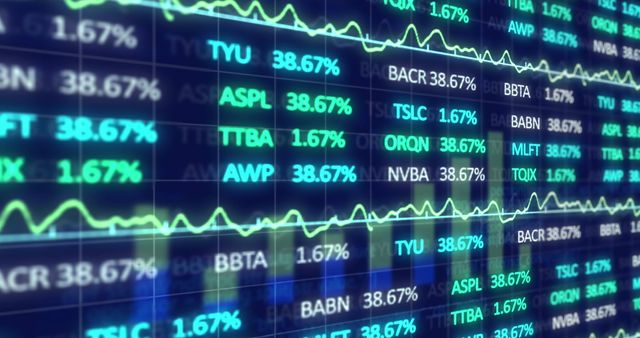
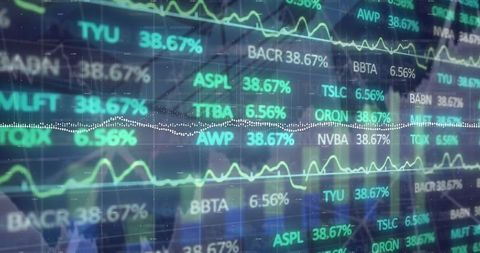
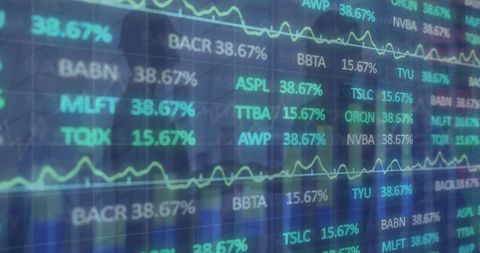
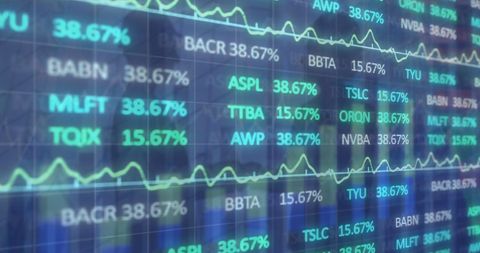
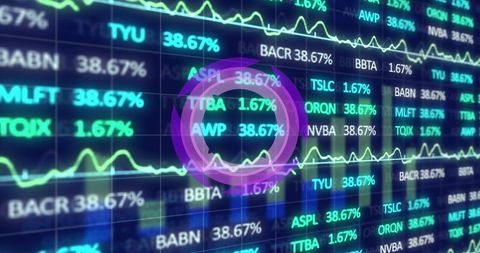
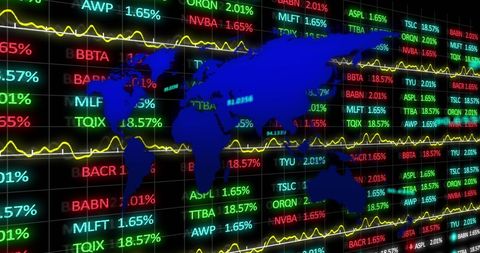
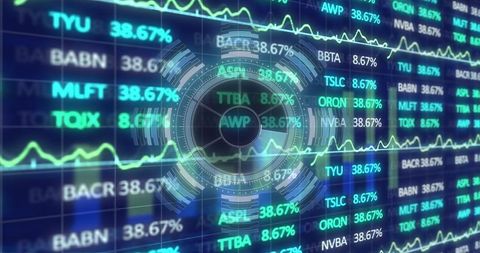
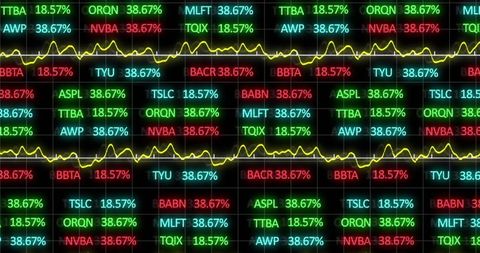
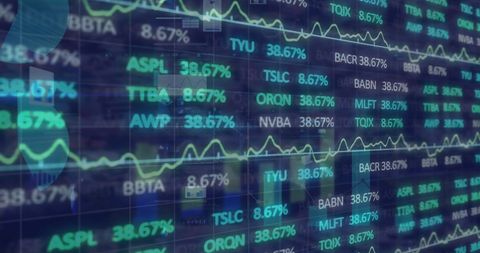
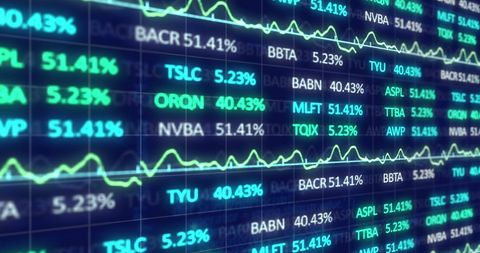
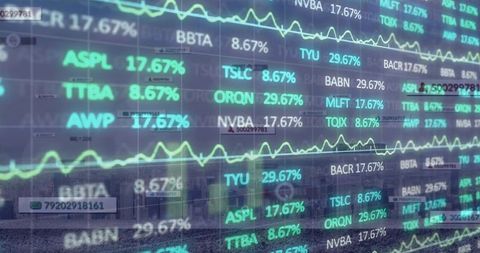
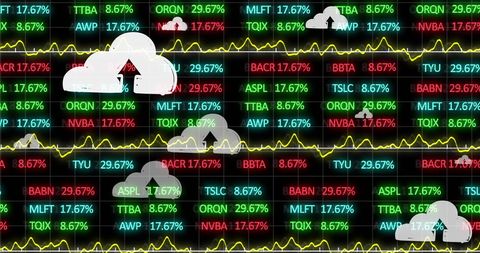
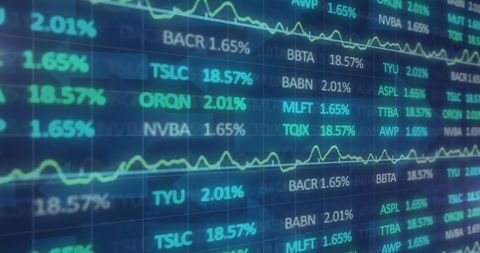
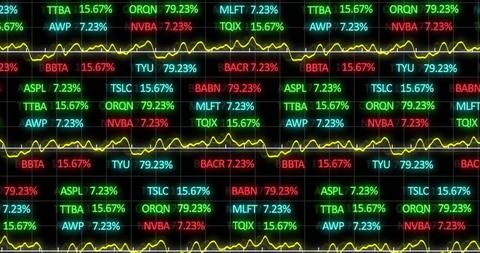
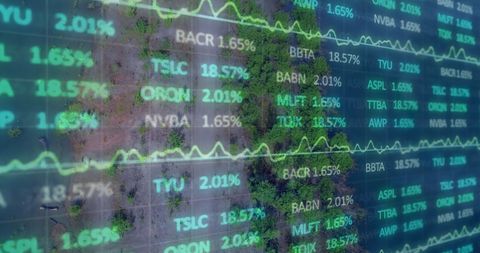
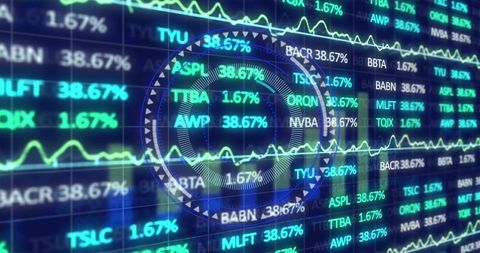
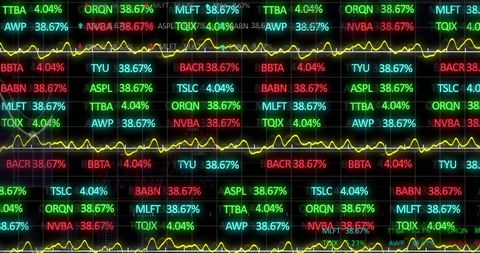
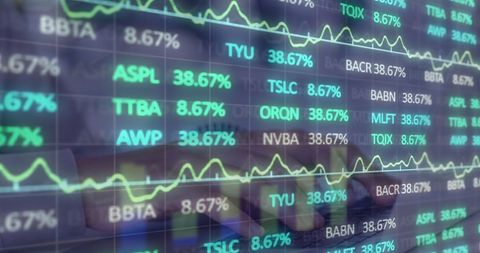
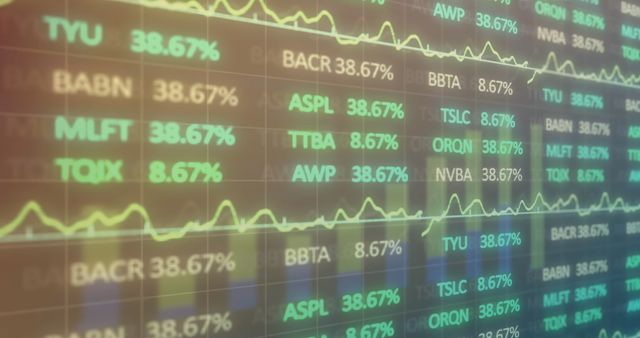
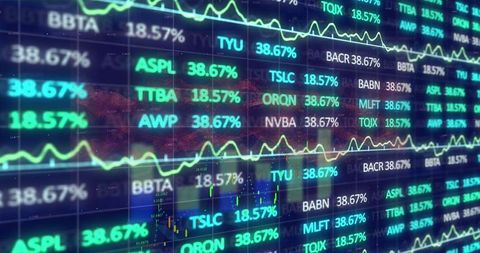
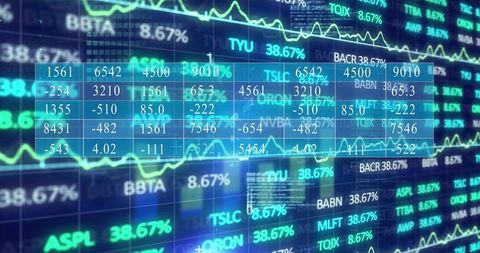
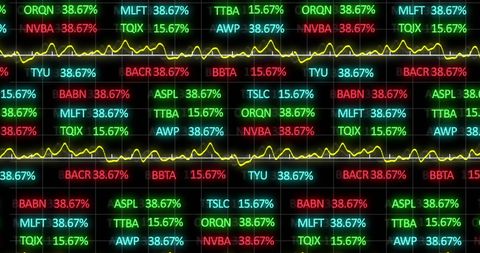
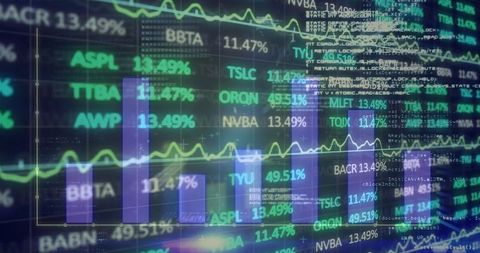
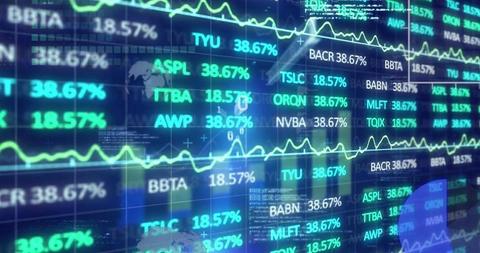
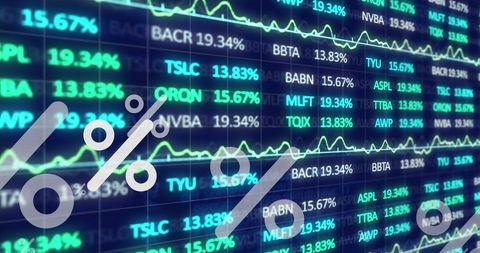
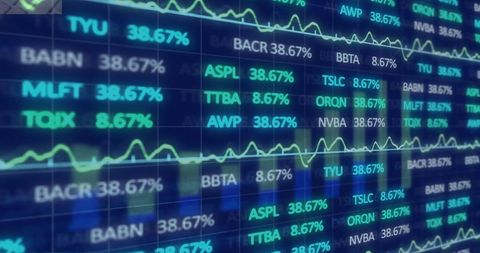
Features vivid digital representation of dynamic stock market data through neon graphs and financial metrics, presenting information innovation in investing. Ideal for use in presentations, news articles covering financial markets, blogs discussing modern data solutions, educational forums on finance, and enhancing tech or finance-themed visual content.

Powered by Shutterstock logo - Get 15% off with code: PIKWIZARD15
Displaying financial dashboard showing stock tickers and percentages, with yellow line graphs, bars. Tech, finance, analytics, user interface, futuristic, neon, data - Powered by Shutterstock - Get 15% off with code: PIKWIZARD15Financial market graph tracing line charts in trading dashboard, with map overlay and neon percents. Finance, analytics, technology, digital, investment, data, market - Powered by Shutterstock - Get 15% off with code: PIKWIZARD15Displaying digital stock market interface with neon ticker symbols and candlestick markers. Finance, data analysis, financial technology, stock trading, digital interface, investment, market trends - Powered by Shutterstock - Get 15% off with code: PIKWIZARD15Displaying trading dashboard on screen, with stock tickers, percentages, graphs, grid and warnings. Futuristic, technology, analytics, finance, data, digital, immersive - Powered by Shutterstock - Get 15% off with code: PIKWIZARD15stock Trading digital Investment dashboard - Powered by Shutterstock - Get 15% off with code: PIKWIZARD15

Credit Photo

If you would like to credit the Photo, here are some ways you can do so

Free (free of charge)

Free for personal and commercial use.

Author: Awesome Content

Similar Free Stock Images

Financial Data Visualization on Digital Screens and HUD Display
Premium
Displaying dark interface showing tickers with % values, yellow graph and map, glowing RANSOM text. Technology, cyber security, data visualization, digital environment, futuristic, finance, analytics
Digital Stock Market Display with Financial Data Analysis
Premium
Displaying widescreen finance board showing market trends in trading office with tickers and charts. Technology, analytics, investment, visualization, business, digital, enterprise
Premium
Trading console displaying market data in dark grid, with tickers, line graphs and candlestick bars. Technological, analytical, futuristic, financial, dynamic, illuminated, data-driven
Renewable Energy Sector Growth in Financial Markets
Futuristic Stock Market Data Display
Dynamic Stock Market Display with Rising Graphs and Key Indexes
Dynamic Stock Market Display Illustrating Financial Trends
Digital Stock Market Data with Neon Analysis Interface
Digital Stock Market Data Overlapping Business Meeting
Abstract Financial Data on Black Background Displaying Stock Market Trends
Stock Market Analysis with Network Connections and Data Visualization
Premium
Business intelligence. Diagram - Graph Stock Trading, Investment dashboard
Dynamic Financial Data Display on Stock Market Screen
Futuristic Stock Market Data with Digital Connections
Premium
stock Trading digital Investment dashboard
Displaying Holographic Stock Market Dashboard with Live Tickers, Percentages, Trend Lines
Premium
Displaying financial dashboard at trading terminal, with rising arrow chart and social metrics. Technology, analytics, data, finance, investment, digital, interface
Dynamic Stock Market Data Display on Digital Screen
Financial Stock Exchange Data Analysis on Digital Screen
Dynamic Stock Ticker Display Featuring Cryptocurrency Quotes
Neon Financial Dashboard Showing Digital Stock Tickers, Percent Changes and Line Charts
Glowing Virtual Data Display on a Dynamic Cityscape
Financial Data Display on Digital Grid Interface Technology
Dynamic Stock Ticker Display with Neon Financial Analytics
Futuristic Digital Stock Market Dashboard with Floating Tickers
Premium
Using digital tablet for stock market analysis
Financial Data on Digital Display Highlighting Global Market Trends
Digital Finance Data and Arrows in Virtual Stock Market
Dynamic Stock Market Data Displayed on Monitors
Dynamic Stock Market Dashboard Showing Real-Time Trading Data
Dynamic Financial Data Display with Analytics Trends
Rotating Globe with Financial Charts Symbolizing Global Economy
Stock Market Data on Digital Screen for Financial Insights
Dynamic Digital Display of Stock Market Trends and Data
Financial Data Monitor Grid with Dynamic Digital Enhancement
Premium
Rendering financial dashboard interface at market data terminal, with data grid, world map, charts. Technology, analytics, modern, futuristic, data visualization, investment, enterprise
Premium
Scrolling ticker symbols, percentages and line charts on trading desk screen with neon accents. Finance, technology, analytics, data visualization, investment, digital, user interface
Premium
Displaying luminous electronic stock market data on trading desk screen, with neon green line graph. Technology, finance, data visualization, digital interface, futuristic, analytics, investment
Premium
Business intelligence. Diagram - Graph Stock Trading, Investment dashboard
Dynamic Stock Market Data and Line Charts
Digitally Generated Stock Ticker Display with Market Data
Digital Financial Data Overlay with World Map
Digital Stock Market Financial Statistics Display
Premium
Business intelligence. Diagram - Graph Stock Trading, Investment dashboard
Abstract Financial Data Compilation on Digital Display
Digital Radar Overlay on Financial Data and Stock Market Graphs
Digital Finance Data and Real-Time Market Analysis
Futuristic Financial Data with Digital Interface and Analytics
Premium
Stock Market Financial Trading Screen on LCD screen.
Dynamic Digital Stock Market Dashboard with Financial Data Graphs
Digital Financial Data Display with Graphs and Charts
Stock Market Data Displayed on Futuristic Digital Interface
Financial Market Data Analysis Projection Graphs
Dynamic Stock Ticker Display with Financial Data Graphics
Digital Stock Market Finance Data Display with Statistical Graphs
Digital Financial Data Display Screen with Stock Trends
Colleagues Analyzing Digital Stock Market Charts in Office
Premium
The fall of coronavirus exchanges . Data analyzing in Forex, Fixed Income and Emerging Markets: the charts and summary info show about "Business statistics and Analytics value" - Wealth management c
Premium
Business intelligence. Diagram - Graph Stock Trading, Investment dashboard
Real-Time Stock Market Data Analysis Display
Global Stock Market Data with Nature Overlay
Modern LED Stock Ticker Display with Vibrant Stock Trends
Premium
Displaying translucent interface panels at trading terminal, with line charts gauge and tickers. Data visualization, stock analytics, ui design, futuristic, finance, digital dashboard, technological
Digital Financial Data Analysis in Global Business Finance
Digital Financial Data with Stock Market Analysis Concepts
Dynamic Stock Market Data with Interactive Tickers and Digital Graphs
Financial Market Data Displays with Ticker Symbols and Trends
Digital Stock Market Ticker Display with Interactive Graphs
Dynamic Stock Market Ticker Displaying Financial Data Fluctuations
Financial Data Processing Overlaid on Global Business Scene
Digital Financial Data Processing Over Solar Panels
Digital Screen Displaying Stock Market Data and Trends
Dynamic Stock Market Data Tickers with Colorful Lines
Digital Clock on Live Financial Stock Market Data Display
Digital Data and Renewable Energy Technologies Overlay
Financial Data Visualization in Global Business Technology Background
Dynamic Financial Data with Stock Market Analysis
Dynamic Stock Market Data Overlay with Graph Lines
Close-Up of Laptop Reflecting Stock Data with Technology on Desk
Dynamic Stock Market Data Display with Charts and Graphs
Financial Data Processing on Digital Screen Visualization
Premium
Business intelligence. Diagram - Graph Stock Trading, Investment dashboard
Blurred Financial Data Display Featuring Line Charts and Tickers
Solar Panels with Financial Data Overlay Representing Green Energy Growth
Digital Display of Stock Market Data Trends
Financial Data Showing Real-Time Stock Live Trends Overlay
Futuristic Financial Dashboard with Charts and Market Data
Futuristic Financial Market Visualization with Holographic Data Interface
Digital Finance Dashboard with Global Stock Market Trends
Stock Market Analysis Dashboard Display Trends Alerts
Digital Financial Data with Highlighted Percentage Symbols
Dynamic Financial Data Analysis on Digital Interface
Dynamic Stock Market Tickers and Graphs on Digital Display
Stock Market Decline Represented by Red Arrow and Ticker Data
Dynamic Stock Market Data With Digital Trading Analysis
Digital Stock Market Data Overlaying Natural Landscape
Dynamic Digital Stock Market Display with Tickers and Analytics
Dynamic Stock Market Data on Digital Screen
Financial Data Interface Over Cityscape
Abstract Financial Data and Cityscape City Light Overlay
Global Finance with Spinning Globe and Stock Data Background
Global Financial Data Overlay with Urban Backdrop
Dynamic Digital Stock Market Trends Liaised with Graphics
Premium
Showing financial interface with holographic circular element and live market data on grid backdrop. Technology, innovation, analytics, visualization, digital, finance, futuristic
Premium
Framing neon pink highlight drawing white SALES text over globe on trading dashboard, with tickers. Neon, finance, technology, digital, data visualization, analytics, investment
Digital Interface and Stock Market Data with Blurred Hands Typing
Digital Financial Data Processing and Stock Market Analysis Visualization
Stock Market Data on Global Map Background for Financial Insights
Dynamic Stock Market Display with Financial Data Trends
Premium
Displaying candlestick chart featuring trend lines, red markers and numeric labels on dashboard. Analytics, finance, data, technology, dashboard, investment, market
Digital Data Analysis for Global Business Platforms
Financial Data Display with Stock Market Graphs Analysis
Digital Financial Data on Vibrant Stock Market Display
Stock Market Data Display on Digital Screen with Price Changes
Premium
stock Trading digital Investment dashboard
Premium
Stock Exchange Trading Forex Finance Graphic Concept
Premium
Business intelligence. Diagram - Graph Stock Trading, Investment dashboard
Premium
Displaying LED ticker showing stock symbols and percentages on trading floor, with chart overlays. Financial dashboard, technology, vibrant, analytics, investment, high-tech, data visualization
Digital Stock Market Trading Board with Holographic Elements
Neon Financial Ticker Display Overlaying Urban Skyline with Animated Percent Graphs
Digital Visualization of Global Stock Market Dynamics
Dynamic Stock Market Display with Real-Time Data
Premium
Pointing bold red arrow moving upward across virtual dashboard, with bar charts and ticker panels. Finance, analytics, technology, investment, data, charting, digital
Explore More Free Stock Images