
- Home >
- Stock Photos >
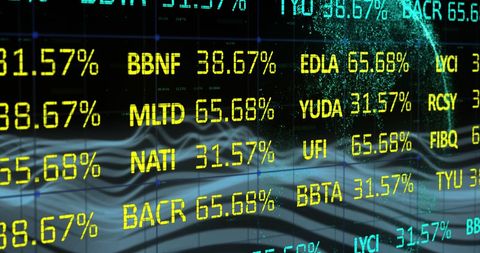
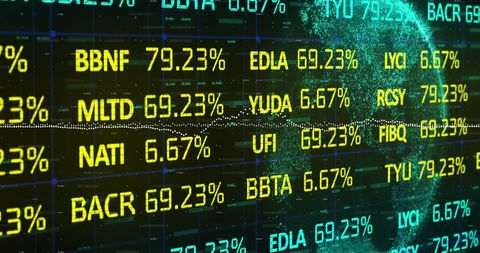
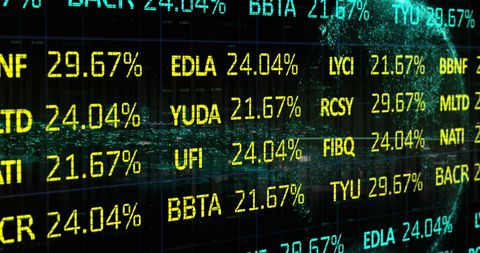
- Digital Stock Exchange Interface with Data Analytics
Digital Stock Exchange Interface with Data Analytics Image
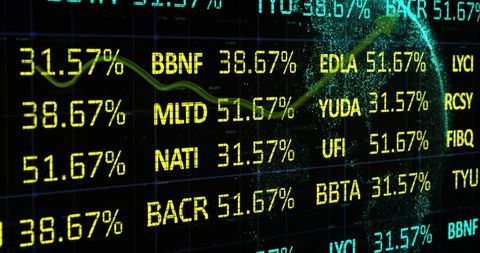
This visual showcases a digital stock exchange interface with various stock symbols and percentages, providing insights into financial data processing. Green graphs represent market trends amidst an array of coded stock data, symbolizing global finance dynamics and business growth. Useful for illustrating concepts of investment analysis, financial performance, and trading in technical and business presentations or articles.
Powered by  - Get 15% off with code: PIKWIZARD15


downloads
Tags:
More
Credit Photo
If you would like to credit the Photo, here are some ways you can do so
Text Link
photo Link
<span class="text-link">
<span>
<a target="_blank" href=https://pikwizard.com/photo/digital-stock-exchange-interface-with-data-analytics/2ca44d9f258ebc1adb7ff94bf88f8b2b/>PikWizard</a>
</span>
</span>
<span class="image-link">
<span
style="margin: 0 0 20px 0; display: inline-block; vertical-align: middle; width: 100%;"
>
<a
target="_blank"
href="https://pikwizard.com/photo/digital-stock-exchange-interface-with-data-analytics/2ca44d9f258ebc1adb7ff94bf88f8b2b/"
style="text-decoration: none; font-size: 10px; margin: 0;"
>
<img src="https://pikwizard.com/pw/medium/2ca44d9f258ebc1adb7ff94bf88f8b2b.jpg" style="margin: 0; width: 100%;" alt="" />
<p style="font-size: 12px; margin: 0;">PikWizard</p>
</a>
</span>
</span>
Free (free of charge)
Free for personal and commercial use.
Author: Creative Art
Similar Free Stock Images

Premium

Premium

Premium


Premium


Premium


Premium


Premium


Premium

Premium

Premium

Premium


Premium


Premium


Premium


Premium


Premium


Premium


Premium


Premium


Premium


Premium

Premium


Premium


Premium


Premium


Explore More Free Stock Images