
- Home >
- Stock Photos >
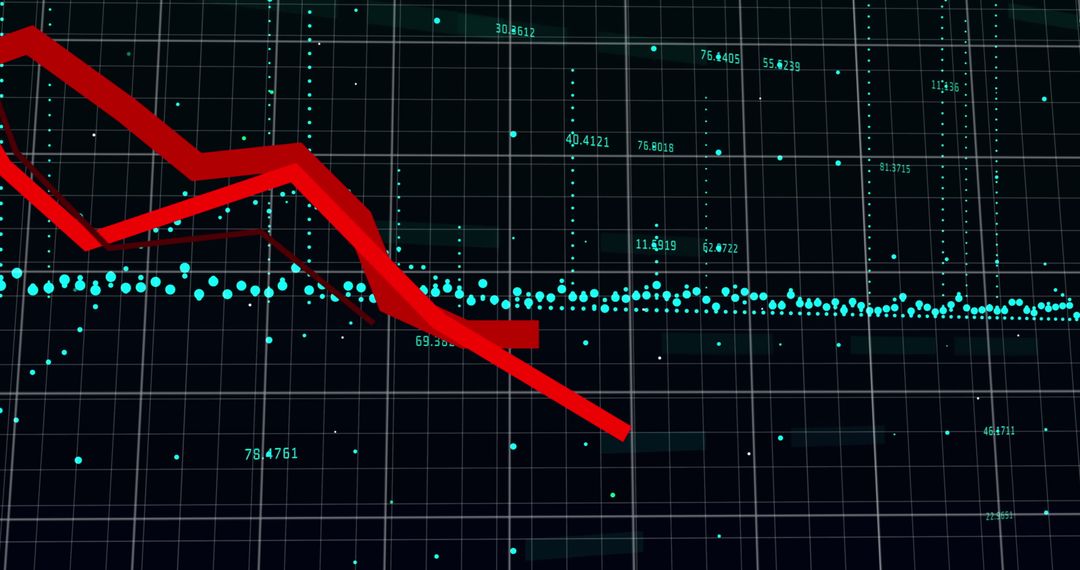
- Digital Stock Market Analysis Display with Graphs
Digital Stock Market Analysis Display with Graphs Image

Glowing digital graphs display various financial data and stock market trends over a black background grid. Ideal for illustrating concepts related to businessmen tracking financial performance, economic analysis, and digital technology. Useful in presentations, reports about business and market analysis, and educational materials on financial technologies.
Powered by  - Get 15% off with code: PIKWIZARD15


2
downloads
downloads
Tags:
More
Credit Photo
If you would like to credit the Photo, here are some ways you can do so
Text Link
photo Link
<span class="text-link">
<span>
<a target="_blank" href=https://pikwizard.com/photo/digital-stock-market-analysis-display-with-graphs/2c73df8b0539f5c60b62ebd6b3e188f3/>PikWizard</a>
</span>
</span>
<span class="image-link">
<span
style="margin: 0 0 20px 0; display: inline-block; vertical-align: middle; width: 100%;"
>
<a
target="_blank"
href="https://pikwizard.com/photo/digital-stock-market-analysis-display-with-graphs/2c73df8b0539f5c60b62ebd6b3e188f3/"
style="text-decoration: none; font-size: 10px; margin: 0;"
>
<img src="https://pikwizard.com/pw/medium/2c73df8b0539f5c60b62ebd6b3e188f3.jpg" style="margin: 0; width: 100%;" alt="" />
<p style="font-size: 12px; margin: 0;">PikWizard</p>
</a>
</span>
</span>
Free (free of charge)
Free for personal and commercial use.
Author: Authentic Images
Similar Free Stock Images

Premium


Premium


Premium


Premium


Premium


Premium


Premium


Premium


Premium


Premium


Premium


Premium


Premium


Premium


Premium


Premium


Premium


Premium


Premium


Premium


Premium


Premium


Premium


Premium

