1. Home > 
  2. Stock Photos > 
  3. Digital Stock Market Analysis Interface on Notepad

Digital Stock Market Analysis Interface on Notepad Image

Digital Stock Market Analysis Interface on Notepad

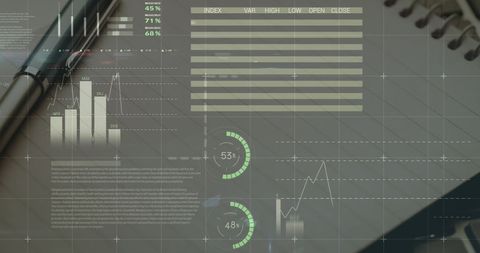
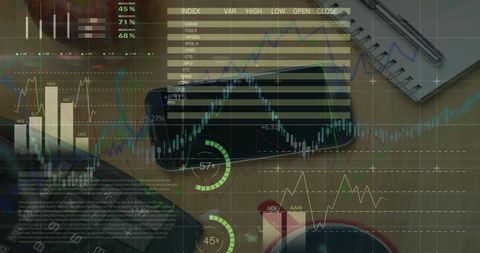
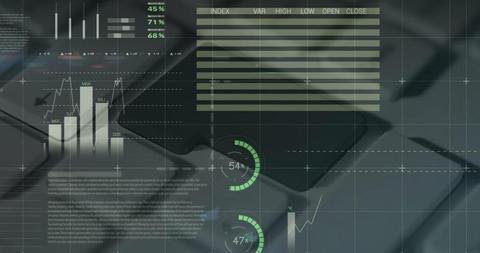
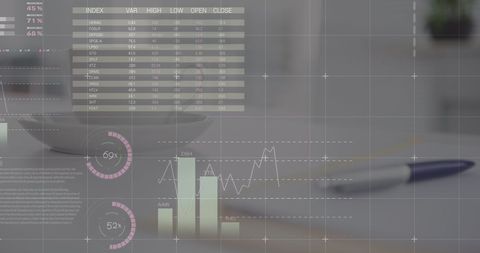
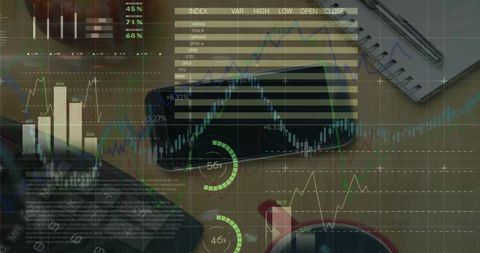
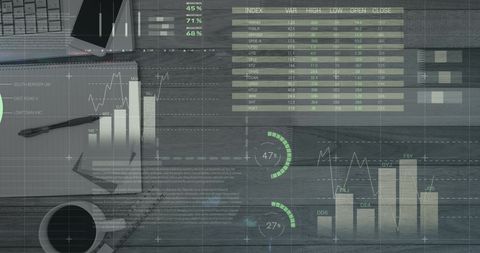
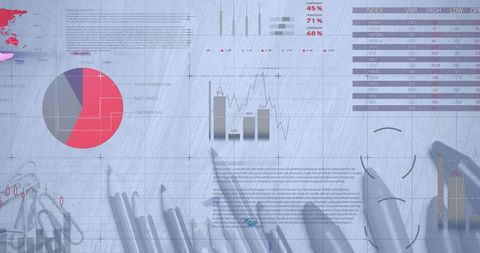
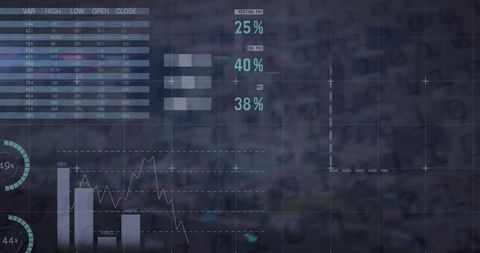
Futuristic display of digital analytics related to stock markets and business growth placed over a pen and notepad. Represents modern methods of tracking financial trends and business data. Suitable for articles or presentations on finance, technology in business practices, or innovative data visualization techniques.

Powered by Shutterstock logo - Get 15% off with code: PIKWIZARD15
A professional person analyzes financial growth and business data on a digital screen. Perfect for data science, market research, analytics dashboards, and corporate performance monitoring concepts. - Powered by Shutterstock - Get 15% off with code: PIKWIZARD15Businessman using futuristic user interface with virtual data analytics. Innovative dashboard with financial charts, graphs, and global network information for business intelligence. - Powered by Shutterstock - Get 15% off with code: PIKWIZARD15An advanced AI system for business and financial analysis. A futuristic interface for commanding an AI to process data from various domains. Motif - Powered by Shutterstock - Get 15% off with code: PIKWIZARD15Data dashboard and analytics system supports business, analytics, and data insights through centralized charts, statistics, and monitoring interface Vouch - Powered by Shutterstock - Get 15% off with code: PIKWIZARD15Data analytics dashboard with charts, indicators, and performance metrics, reveals trends, data analytics drives growth, supports insight, and data analytics improves decisions. Vouch - Powered by Shutterstock - Get 15% off with code: PIKWIZARD15

Credit Photo

If you would like to credit the Photo, here are some ways you can do so

Free (free of charge)

Free for personal and commercial use.

Author: People Creations

Similar Free Stock Images

Silhouettes Passing Baton Over Financial Data and Sports Track Blend
Premium
Business data analytics and intelligence dashboard concept, businessman using futuristic holographic graphs and charts on laptop, big data analysis, KPIs, statistics, digital transformation.
Interactive Data Analytics and DNA Digital Interface
Dynamic Financial Analysis with Digital Graphs and Fountain Pen
Digital Data Overlap with Credit Card Machine Interface Concept
Digital Analytics Interface with Dynamic Charts and Social Media Icons
Premium
Analyzing hands with black nails viewing data charts on smartphone over wooden desk, with tablet. Technology, data, analytics, finance, workspace, professional, modern
Digital Holographic Infographic Display with Charts and Data
Infographic Interface with Diverse People's Shadows on Street
Futuristic Data Analysis Dashboard with Graphs
Digital Visualization of Financial Data and Analytics
Modern Financial Data Charts with Futuristic Interface
Premium
Displaying calculator keypad and tablet showing charts gauge indicators and data table in interface. Financial technology, digital analysis, data visualization, modern interface, business intelligence
Digital Financial Interface Overlaying Modern Urban Cityscape
Digital Financial Data Display with Graphs and Analytics
Futuristic Infographic Interface Overlay on Modern Cityscape
Stock Market Analysis with Multi-Layer Graphs and Charts
Digital Financial Data Interface with Business Analytics
Futuristic Data Visualization with Graphs and Analytics Interface
Digital Data Interface with Cityscape Background for Global Business
Digital Financial Data Analysis on Office Desk
Premium
Displaying anemometer and wind vane spinning at weather station, data overlays, copy space. Meteorology, weather monitoring, data visualization, climate analysis, environmental analytics, digital
Digital Analytics and Financial Data on Blue Background
Futuristic Digital Data Processing with Charts and Graphs Overlay
Digital Representation of Financial Analytics with Graphs and Charts
Advanced Data Processing and Visualization on Digital Interface
Premium
Businessman analyzing financial data and digital marketing charts on laptop, focusing on growth, profit, and investment strategy using futuristic technology and virtual analytics interface.
Statistical Data Overlay with Pen and Diary Background
Digital Financial Data Analysis on Workspace with Stationery
Digital Data Analysis with Futuristic Charts
Corporate Analytics Concept with Digital Charts and Document
Premium
A hand interacting with financial data graphs on a digital interface, set against a blurred office background
Data Analysis Graphics Overlay on Card Reader
Global Data Visualization with Interactive Digital Interface
Premium
Hands typing on laptop with digital analytics dashboard, charts, and graphs overlayed, on bright background. Concept of data and business analysis
Business Graph Analysis on Office Desk with Stationery
Financial Data Visualization with Interactive Graphs and Charts
Digital Interface with Graphs and Charts for Data Analysis
Digital Financial Analytics Overlaid on Office Desk
Premium
Hand touching digital screen showing stock market charts and rising data bars with glowing blue graphics, on dark blurred office background
Digital Financial Charts Displaying Market Trends and Data
Statistical Data Processing and Analysis on Blue Background
Futuristic Data Processing with Digital Graphics
Premium
Showing digital market display scrolling stock symbols on dark grid, with yellow line graphs. Financial technology, data visualization, stock market analysis, trading platform, digital interface,
Infographic Interface Overlay with Pen, Report, and Coffee Cup
Digital Data Analytics Interface Overlaid on Scenic Landscape
Notebook and Pen on Tech Workspace with Neon AI Neural Network Overlay for Innovation
Financial Data and Architectural Plans Overlap
Premium
Business meeting with hands on documents, charts, and graphs. Focus on data analysis, strategy, and teamwork. Professional setting data analysis meeting with digital overlay.
Premium
KPI Dashboard on virtual screen. Businessman analysing finance data graph on stock market. Financial management technology.	
Dashboard a wallet Account digital.
Premium
A person analyzing financial data on transparent screens with a futuristic interface, set against a dark background, concept of modern finance
Premium
Businessman analyzing financial data on digital tablet.
Abstract Financial and Statistical Data Visualization on Screen
Modern Technology Displaying Digital Graphs and Transmission Tower
Digital Finance Analytics in Modern Business Environment
Futuristic Infographic Interface with Cityscape Background
Premium
Trader hand analysis stock market graph, business financial growth. Investment profit, candlestick chart, digital technology. Virtual interface, fund management, stock exchange, crypto, success.
Digital Composite Trading Data and Growth Analytics
Digital Financial Data Display on Wooden Desk
Digital Financial Market Data Analyzing on Modern Screen
Futuristic Digital Dashboard with Financial Data Analysis
Premium
Hand holding smartphone displays data visualizations, including histogram and pie chart. Analytics, digital transformation and increasing use of mobile technology in business. Minimalist art collage.
Statistical Data Analysis with Dynamic Business Analytics
Digital Interface with Data Visualization and Analytics Elements
Digital Financial Dashboard with Cityscape Background
Infographic Interface Overlay on Aerial Cityscape Conveys Business Growth
Premium
Professional examines financial graphs on digital interface, symbolizing data analysis and market research, highlighting importance of informed decision-making in trading
Premium
Businessman analyzing virtual graph chart on laptop screen. Concept of data analysis, financial growth, performance tracking, digital technology, and business intelligence.
Digital Financial Data Interface with Graphs and Charts
Digital Data Processing and Network Visualization Concept
Data Analysis and Technology Screens with Mathematical Equations
Digital Data Interface Over Urban Landscape with Analytics
Global Financial Data Processing with Graphs and Charts on Dark Background
Financial Data Visualization with Futuristic Digital Interface
Digital Interface Showing Financial Charts and Data Analysis
Futuristic Data Visualizations with Graphs and Charts Overlay
Premium
Digital banking innovation integrates finance and technology to enhance online banking, mobile services, and fintech for seamless financial experiences. Latch
Futuristic Digital Display with Dynamic Charts and Graphs
Businessman Analyzing Data with Pen and Paper Amid Financial Graphics
Digital Composite of Stock Market Trends and Analytics
Business Infographic Interface Over Modern Cityscape at Sunset
Business Data Analysis Fintech Statistics Charts
Digital Progress Interface on Work Desk Setup
Infographic Interface over Cityscape with Financial Data and Statistics
Financial Planning Desk with Stock Market Data Overlay
Premium
KPIs to improve organizational performance, Business analytics with charts, Businesswoman use computers to analyze business and manage corporate data in office, Financial and marketing strategy.
Digital Interface with Financial Graphs and Analytics
Digital Interface with Data Visuals for Technology Concepts
Infographic Interface Over Cityscape: Business Growth Analysis
Futuristic Financial Data Analysis with Charts and Graphs
Premium
Businessman analyzing growth data using digital dashboard and laptop. Futuristic interface showing rising graph and financial metrics. Concept of smart investment, fintech, and business performance.
Abstract Financial Data Overlay Design with Cityscape Background
Futuristic Data Processing with Mathematical Equations and Graphs
Infographic Interface and Business Desk Elements Mixed
Digital Interface with Calculator and Data Visualization
Digital Data Interface Overlay on Landscape Background
Futuristic Digital Interface Overlaying Cityscape
Digital Stock Market Dashboard Over Cityscape
Abstract Financial Data and Credit Card Machine Concept
Futuristic Digital Interface Displaying Statistics and Graphs
Infographic Interface Overlay on City Skyline Visualizing Data
High Tech Financial Data Visualization with Analytics
Premium
Digital currency symbols with glowing neon interface over a city skyline, depicting fintech, market price data, and financial exchange concept
Premium
Business analytics with charts, Business people use computers to analyze business and manage corporate data in office, Financial and marketing strategy, KPIs to improve organizational performance.
Digital Financial Data Analysis with Bar and Line Graphs
Digital Finance Analysis with Pen and Notebook
Monochromatic Financial Data and Chart Analysis
Abstract Digital Data Interface on Blue Background
Premium
Businessman analyzing virtual data charts and digital graphs with futuristic interface on dark background, concept of analytics and fintech
Futuristic Data Start Screen with Hexagonal Grid
Financial Data Analysis on Office Desk with Gadgets and Graphs
Digital Finance Analytics Interface with Transparent Cityscape Background
Digital Data Graphics Overlay on Computer Keyboard
Futuristic Infographic Interface Overlaying Urban Cityscape
Integrating Financial Data with Digital Interface Concepts
Digital Data Analysis with Graphs and Charts Interface
Financial Data Processing with Graphical Analysis Interface
Premium
Dynamic Trading: Blue Digital Financial Technology in Action and Innovation
Digital Infographic with Artistic Business Tools Combination
Futuristic Holographic Business Analytics Interface
Ruble Symbol Against Digital Data and Global Business Interface
Dynamic Financial Data on Digital Interface Screen
Premium
A project management dashboard for business. The interface features a Gantt chart to visualize the project timeline, task scheduling, and overall progress for efficient workflow. Parse
Digital Interface Displaying Live Data and Networking Concepts
Global Digital Interface Visualizing Data Processing
Explore More Free Stock Images