- Home >
- Stock Photos >
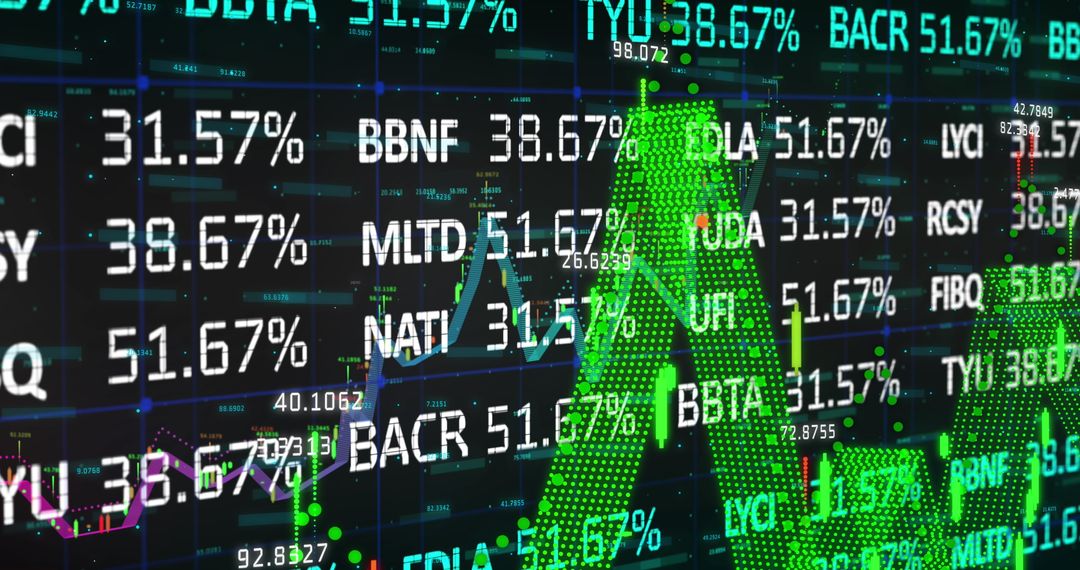
- Digital Stock Market Analysis with Abstract Graphs and Data
Digital Stock Market Analysis with Abstract Graphs and Data Image

Green digital graphs and numerical data dominate a black background capturing essence of modern finance. Lines, percentages, and abstract structures illustrate dynamic market trends. Useful for presentations related to global economy, investment opportunities, trading strategies, or financial analysis visuals.
Powered by 


2
downloads
downloads
Tags:
More
Credit Photo
If you would like to credit the Photo, here are some ways you can do so
Text Link
photo Link
<span class="text-link">
<span>
<a target="_blank" href=https://pikwizard.com/photo/digital-stock-market-analysis-with-abstract-graphs-and-data/0148796e5e6dc5a25be65e18d5c83bf5/>PikWizard</a>
</span>
</span>
<span class="image-link">
<span
style="margin: 0 0 20px 0; display: inline-block; vertical-align: middle; width: 100%;"
>
<a
target="_blank"
href="https://pikwizard.com/photo/digital-stock-market-analysis-with-abstract-graphs-and-data/0148796e5e6dc5a25be65e18d5c83bf5/"
style="text-decoration: none; font-size: 10px; margin: 0;"
>
<img src="https://pikwizard.com/pw/medium/0148796e5e6dc5a25be65e18d5c83bf5.jpg" style="margin: 0; width: 100%;" alt="" />
<p style="font-size: 12px; margin: 0;">PikWizard</p>
</a>
</span>
</span>
Free (free of charge)
Free for personal and commercial use.
Author: Creative Art
Similar Free Stock Images
Premium


Premium


Premium


Premium


Premium


Premium


Premium


Premium


Premium


Premium


Premium


Premium


Premium


Premium


Premium


Premium


Premium


Premium


Premium


Premium


Premium


Premium


Premium


Premium