
- Home >
- Stock Photos >
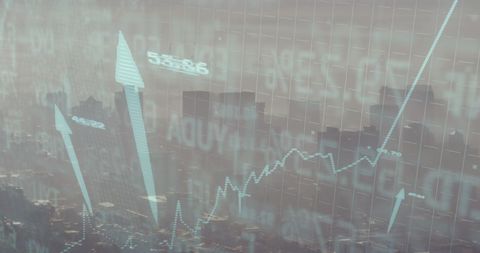
- Digital Stock Market Analysis with Binary Code and Graph
Digital Stock Market Analysis with Binary Code and Graph Image

Illustration depicting stock market analysis using binary code on a digital interface. Red trend line suggests fluctuating market patterns against a backdrop of numbers. Suitable for use in articles or presentations on financial technology, data-driven investment strategies, and the role of Big Data in economic forecasting.
Powered by 


downloads
Tags:
More
Credit Photo
If you would like to credit the Photo, here are some ways you can do so
Text Link
photo Link
<span class="text-link">
<span>
<a target="_blank" href=https://pikwizard.com/photo/digital-stock-market-analysis-with-binary-code-and-graph/eeb1b73a634e13407824d25652f9e636/>PikWizard</a>
</span>
</span>
<span class="image-link">
<span
style="margin: 0 0 20px 0; display: inline-block; vertical-align: middle; width: 100%;"
>
<a
target="_blank"
href="https://pikwizard.com/photo/digital-stock-market-analysis-with-binary-code-and-graph/eeb1b73a634e13407824d25652f9e636/"
style="text-decoration: none; font-size: 10px; margin: 0;"
>
<img src="https://pikwizard.com/pw/medium/eeb1b73a634e13407824d25652f9e636.jpg" style="margin: 0; width: 100%;" alt="" />
<p style="font-size: 12px; margin: 0;">PikWizard</p>
</a>
</span>
</span>
Free (free of charge)
Free for personal and commercial use.
Author: People Creations
Similar Free Stock Images

Premium


Premium


Premium

Premium

Premium

Premium


Premium


Premium

Premium

Premium


Premium


Premium


Premium

Premium

Premium


Premium

Premium

Premium


Premium


Premium


Premium


Premium


Premium


Premium


Premium

Explore More Free Stock Images