
- Home >
- Stock Photos >
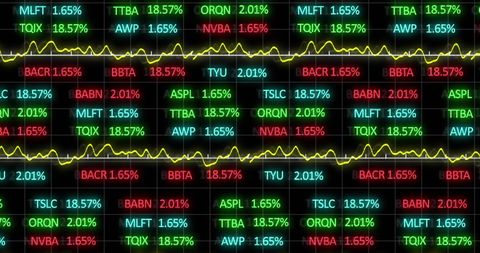
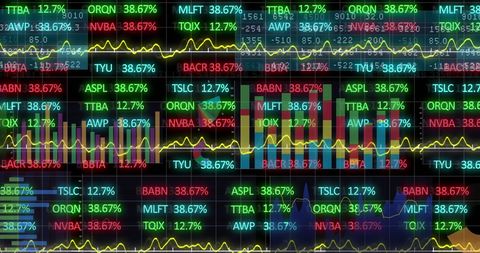
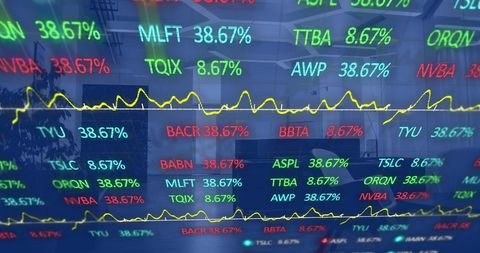
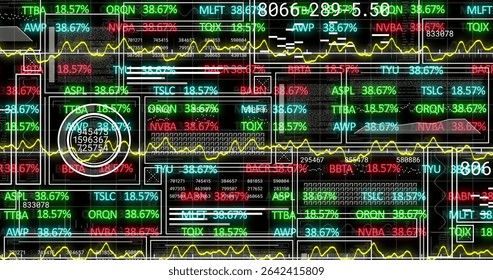
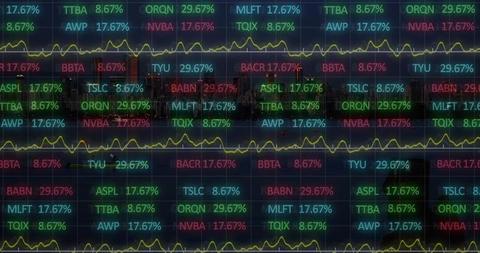
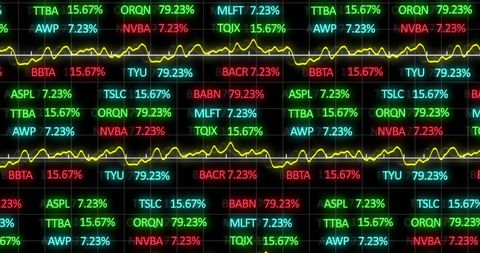
- Digital Stock Market Analysis with Graphs and Data Visualization
Digital Stock Market Analysis with Graphs and Data Visualization Image

Financial data is displayed in a colorful digital format with stock numbers and graphs, symbolizing real-time analysis and predictive analytics in the world market. Ideal for using in articles or promotions about market analysis, digital finance, and investment strategies.
Powered by  - Get 15% off with code: PIKWIZARD15


downloads
Tags:
More
Credit Photo
If you would like to credit the Photo, here are some ways you can do so
Text Link
photo Link
<span class="text-link">
<span>
<a target="_blank" href=https://pikwizard.com/photo/digital-stock-market-analysis-with-graphs-and-data-visualization/c2de7d456cf8867f937ed11ce139969a/>PikWizard</a>
</span>
</span>
<span class="image-link">
<span
style="margin: 0 0 20px 0; display: inline-block; vertical-align: middle; width: 100%;"
>
<a
target="_blank"
href="https://pikwizard.com/photo/digital-stock-market-analysis-with-graphs-and-data-visualization/c2de7d456cf8867f937ed11ce139969a/"
style="text-decoration: none; font-size: 10px; margin: 0;"
>
<img src="https://pikwizard.com/pw/medium/c2de7d456cf8867f937ed11ce139969a.jpg" style="margin: 0; width: 100%;" alt="" />
<p style="font-size: 12px; margin: 0;">PikWizard</p>
</a>
</span>
</span>
Free (free of charge)
Free for personal and commercial use.
Author: Authentic Images
Similar Free Stock Images

Premium


Premium

Premium


Premium


Premium


Premium


Premium


Premium


Premium

Premium

Premium


Premium


Premium


Premium


Premium


Premium


Premium


Premium


Premium


Premium


Premium

Premium


Premium

Premium

Premium


Explore More Free Stock Images