- Home >
- Stock Photos >
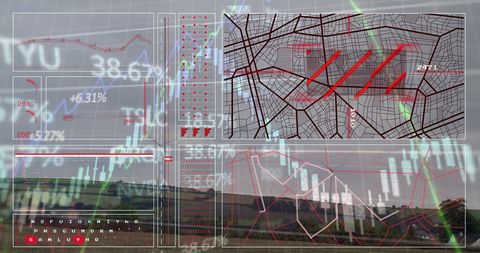
- Digital Stock Market Dashboard Over Cityscape
Digital Stock Market Dashboard Over Cityscape Image

Digital overlay of stock market charts and data on city landscape. Useful for themes of modern finance, economic analysis, investment strategies, and business technology. Ideal for illustrating financial news, economic reports, and corporate presentations.
Powered by  - Get 15% off with code: PIKWIZARD15


downloads
Tags:
More
Credit Photo
If you would like to credit the Photo, here are some ways you can do so
Text Link
photo Link
<span class="text-link">
<span>
<a target="_blank" href=https://pikwizard.com/photo/digital-stock-market-dashboard-over-cityscape/277c34464da63a7b2d1e7ab6d3a36d73/>PikWizard</a>
</span>
</span>
<span class="image-link">
<span
style="margin: 0 0 20px 0; display: inline-block; vertical-align: middle; width: 100%;"
>
<a
target="_blank"
href="https://pikwizard.com/photo/digital-stock-market-dashboard-over-cityscape/277c34464da63a7b2d1e7ab6d3a36d73/"
style="text-decoration: none; font-size: 10px; margin: 0;"
>
<img src="https://pikwizard.com/pw/medium/277c34464da63a7b2d1e7ab6d3a36d73.jpg" style="margin: 0; width: 100%;" alt="" />
<p style="font-size: 12px; margin: 0;">PikWizard</p>
</a>
</span>
</span>
Free (free of charge)
Free for personal and commercial use.
Author: People Creations
Similar Free Stock Images
Loading...

Premium


Premium


Premium


Premium

Premium


Premium

Premium


Premium


Premium

Premium

Premium

Premium


Premium


Premium


Premium


Premium


Premium


Premium


Premium


Premium


Premium


Premium


Premium

Premium


Premium