- Home >
- Stock Photos >
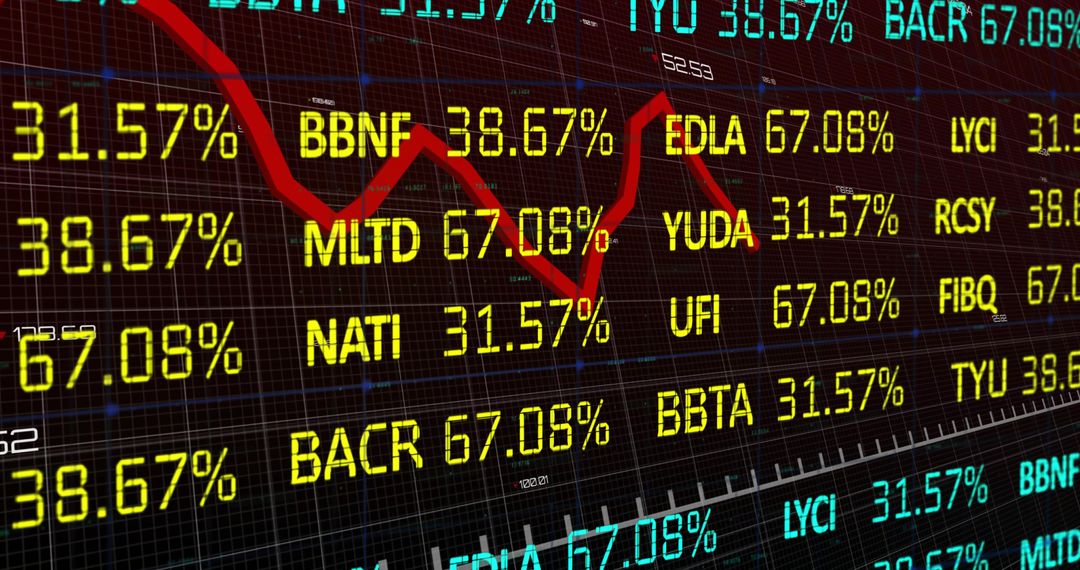
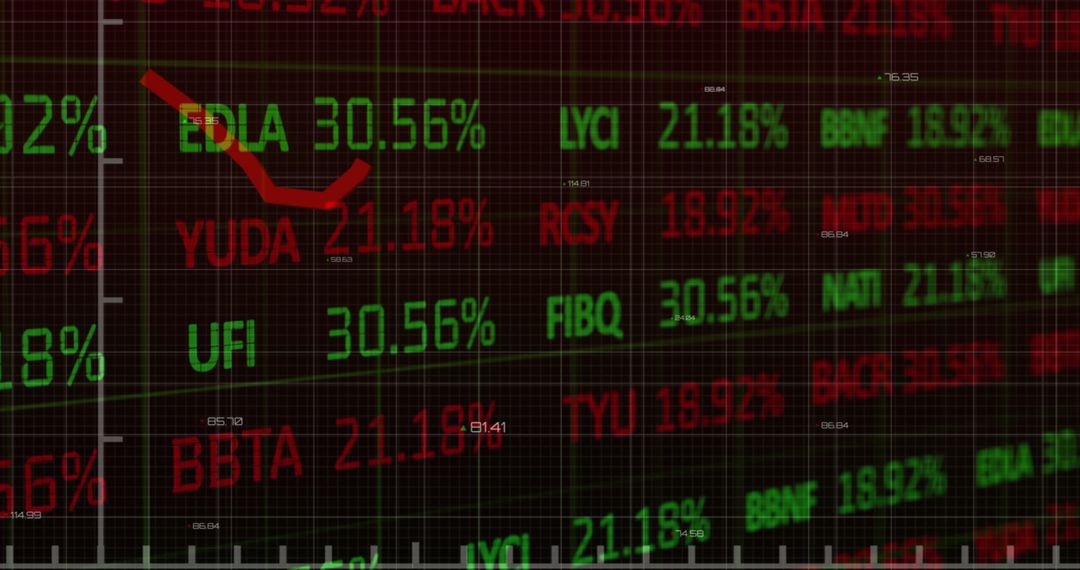
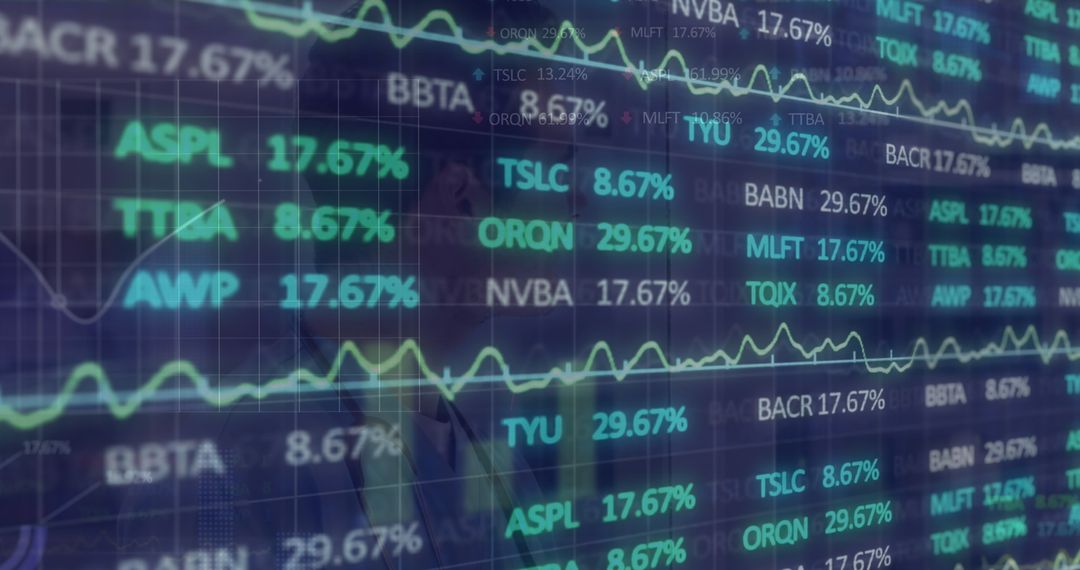
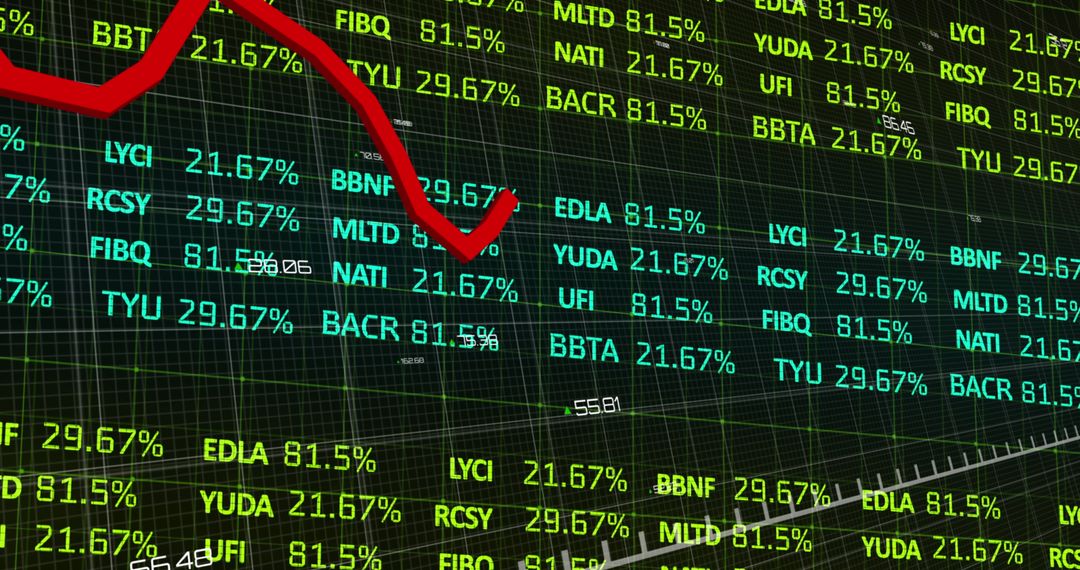
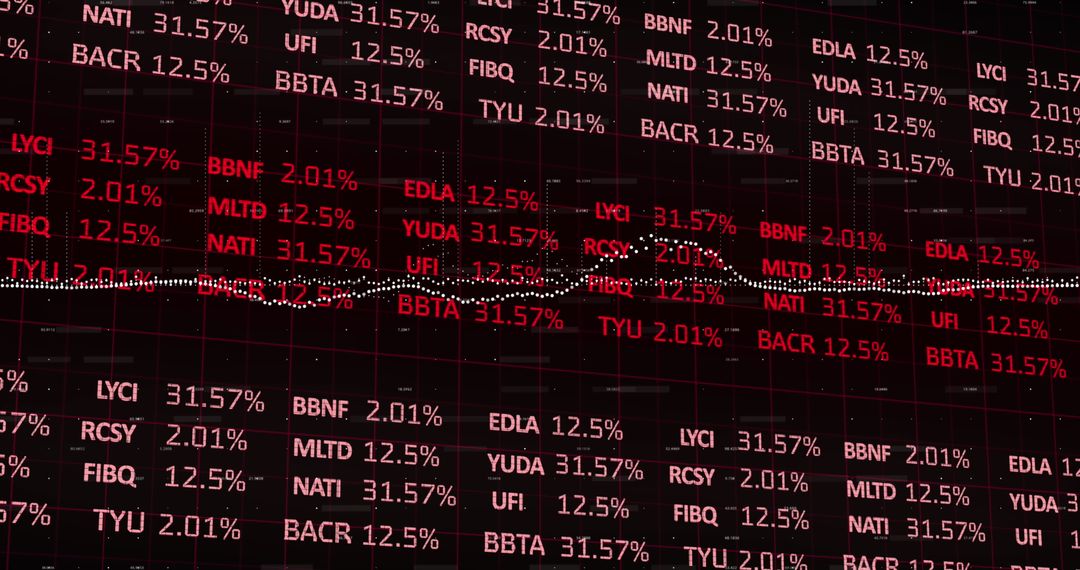
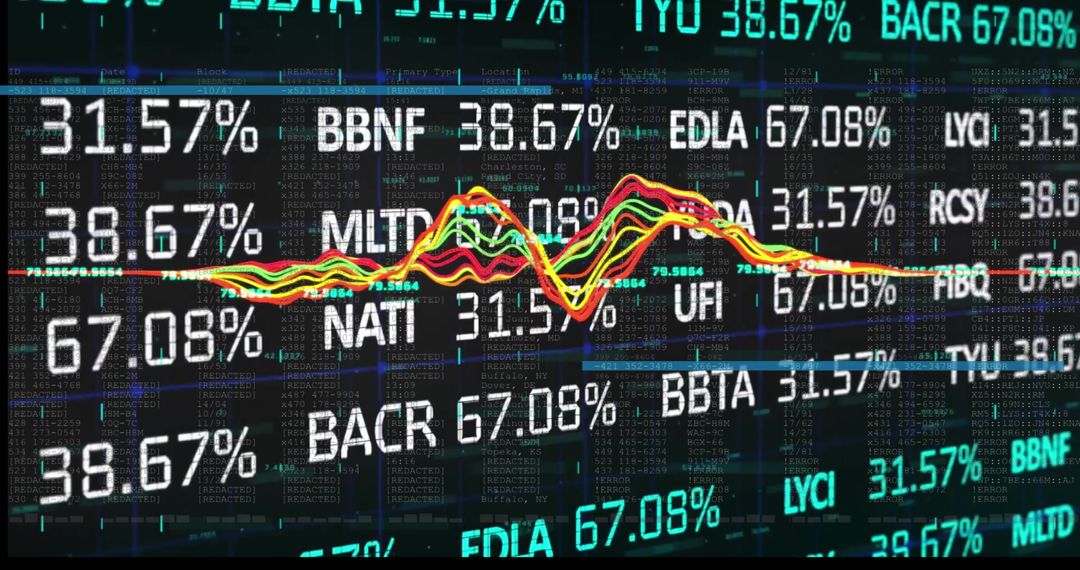
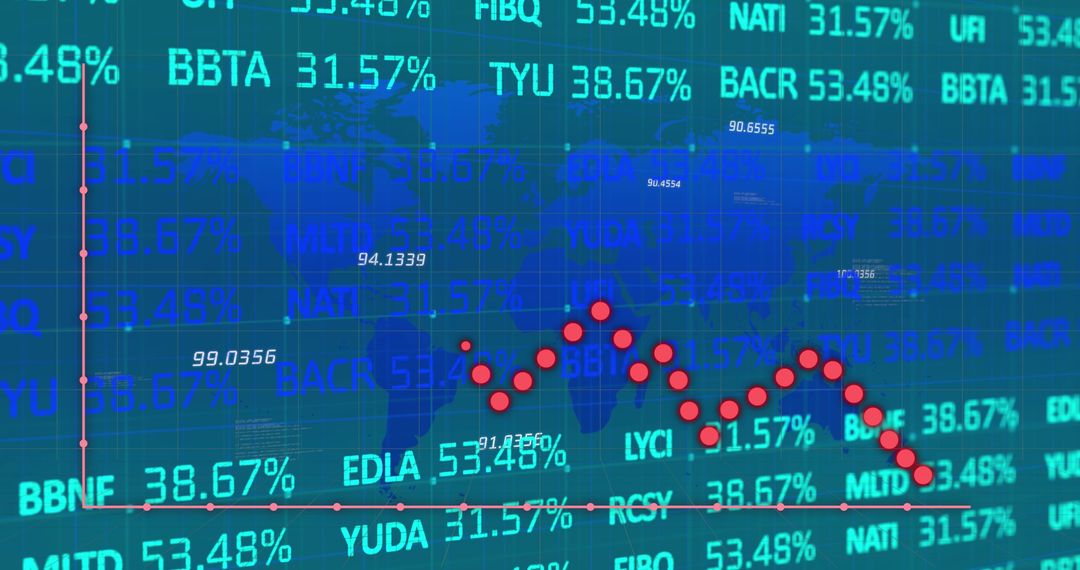
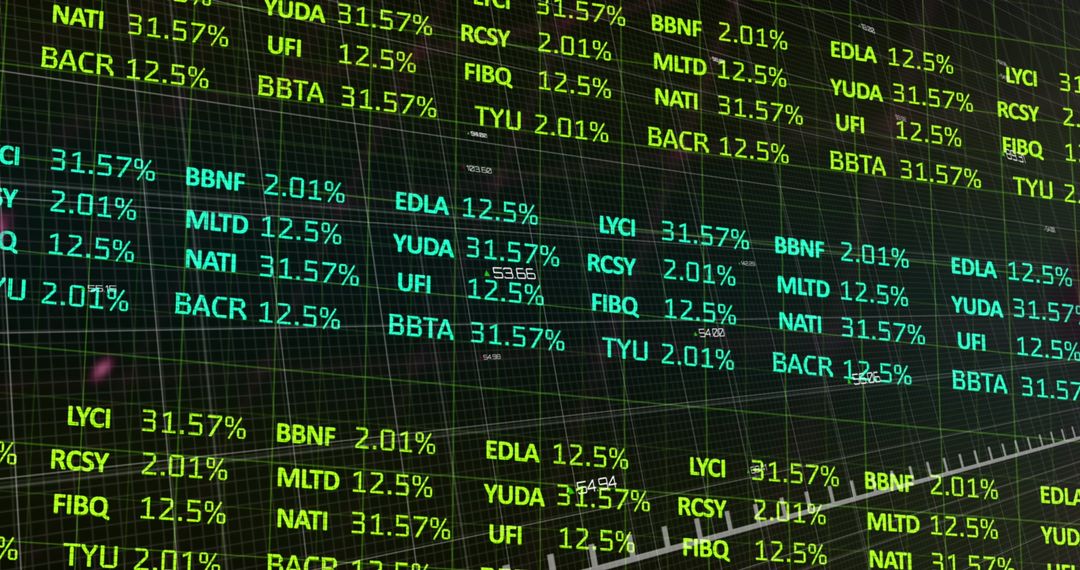
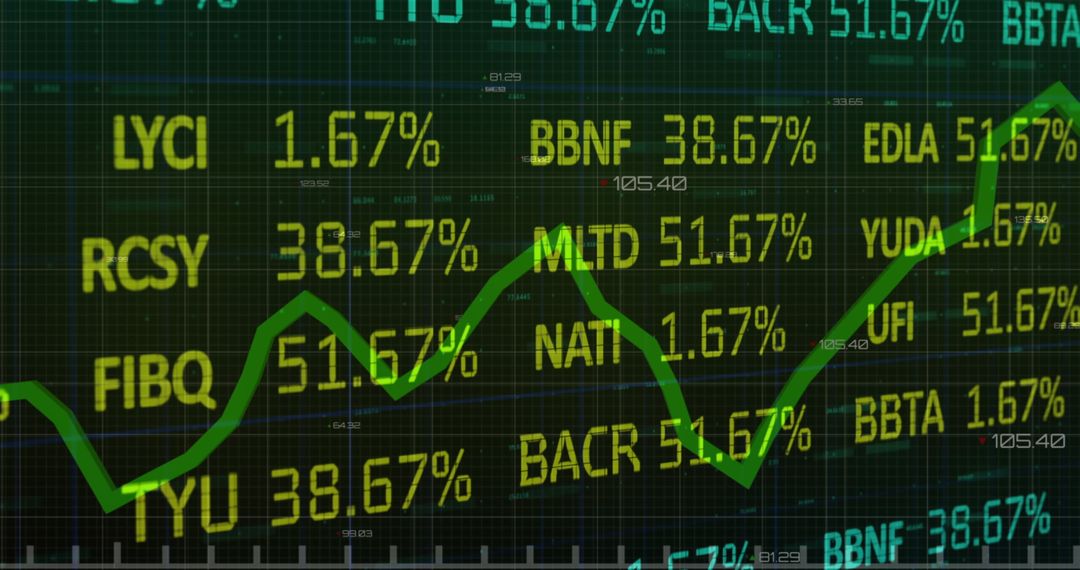
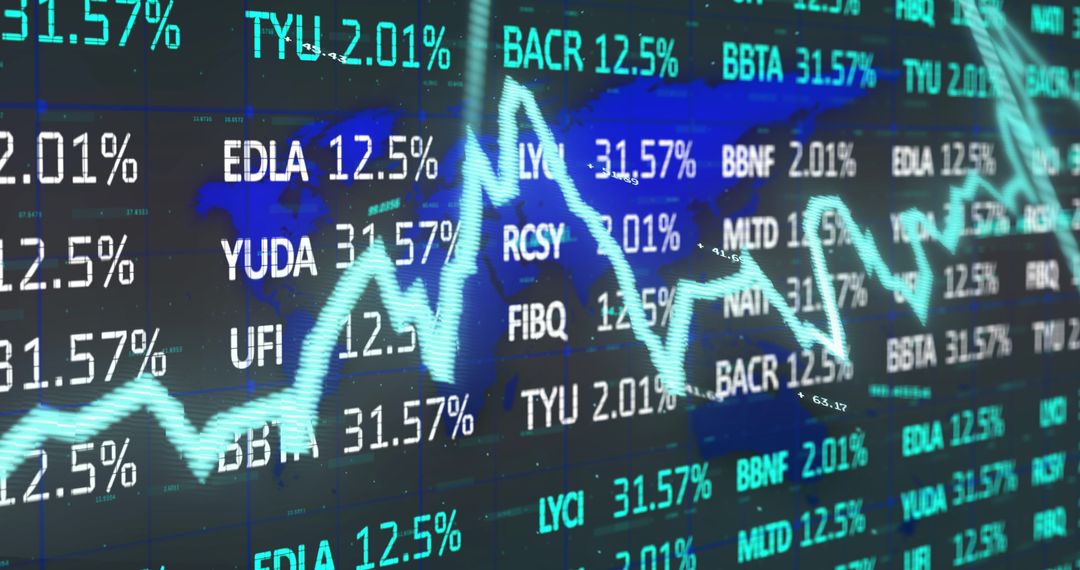
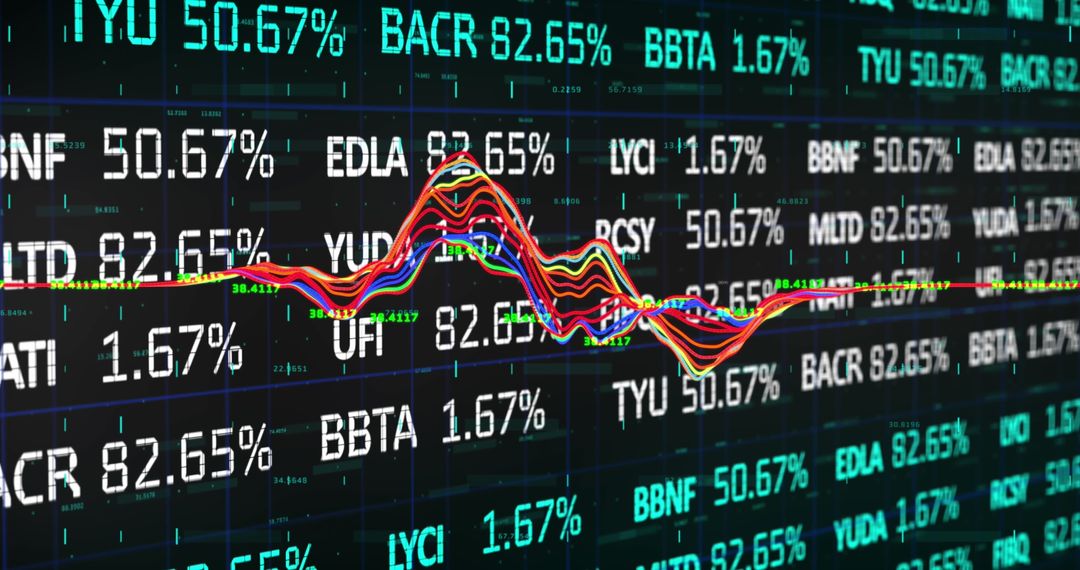
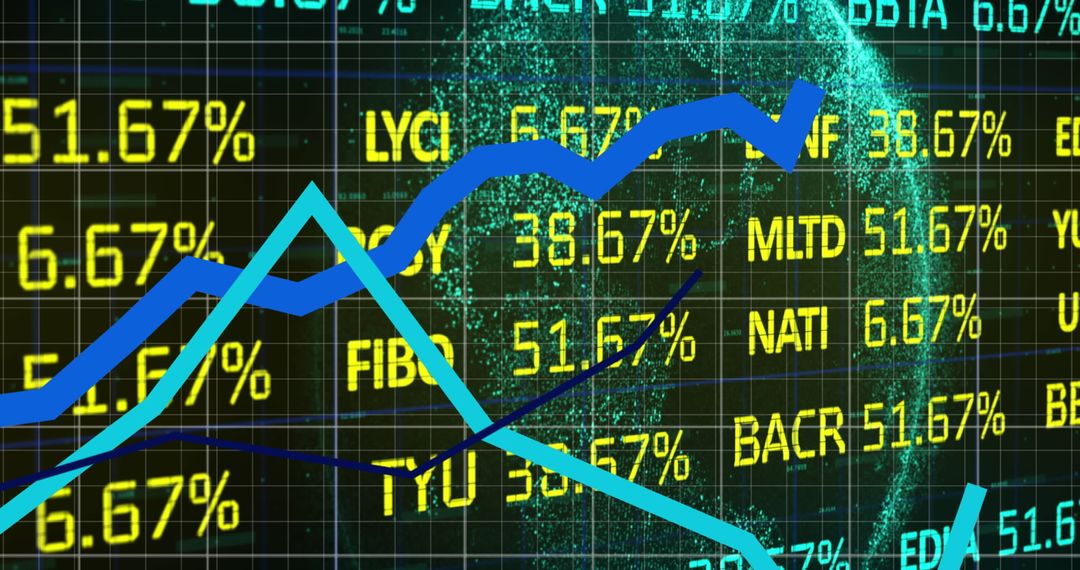
- Digital Stock Market Data and Financial Charts Algorithm
Digital Stock Market Data and Financial Charts Algorithm Image

Showing a dynamic display of stock market data with fluctuating numbers and financial symbols. Suitable for illustrating financial trends in global markets. Ideal for use in finance presentations, articles on market movements, or educational materials focused on investments and trading strategies.
Powered by 


2
downloads
downloads
Tags:
More
Credit Photo
If you would like to credit the Photo, here are some ways you can do so
Text Link
photo Link
<span class="text-link">
<span>
<a target="_blank" href=https://pikwizard.com/photo/digital-stock-market-data-and-financial-charts-algorithm/ad09268776a2f87653442614dd91a4a7/>PikWizard</a>
</span>
</span>
<span class="image-link">
<span
style="margin: 0 0 20px 0; display: inline-block; vertical-align: middle; width: 100%;"
>
<a
target="_blank"
href="https://pikwizard.com/photo/digital-stock-market-data-and-financial-charts-algorithm/ad09268776a2f87653442614dd91a4a7/"
style="text-decoration: none; font-size: 10px; margin: 0;"
>
<img src="https://pikwizard.com/pw/medium/ad09268776a2f87653442614dd91a4a7.jpg" style="margin: 0; width: 100%;" alt="" />
<p style="font-size: 12px; margin: 0;">PikWizard</p>
</a>
</span>
</span>
Free (free of charge)
Free for personal and commercial use.
Author: Authentic Images
Similar Free Stock Images
Premium


Premium


Premium


Premium


Premium


Premium


Premium


Premium


Premium


Premium


Premium


Premium


Premium


Premium


Premium


Premium


Premium


Premium


Premium


Premium


Premium


Premium


Premium


Premium