- Home >
- Stock Photos >
- Digital Stock Market Data Display with Analytical Graphs
Digital Stock Market Data Display with Analytical Graphs Image

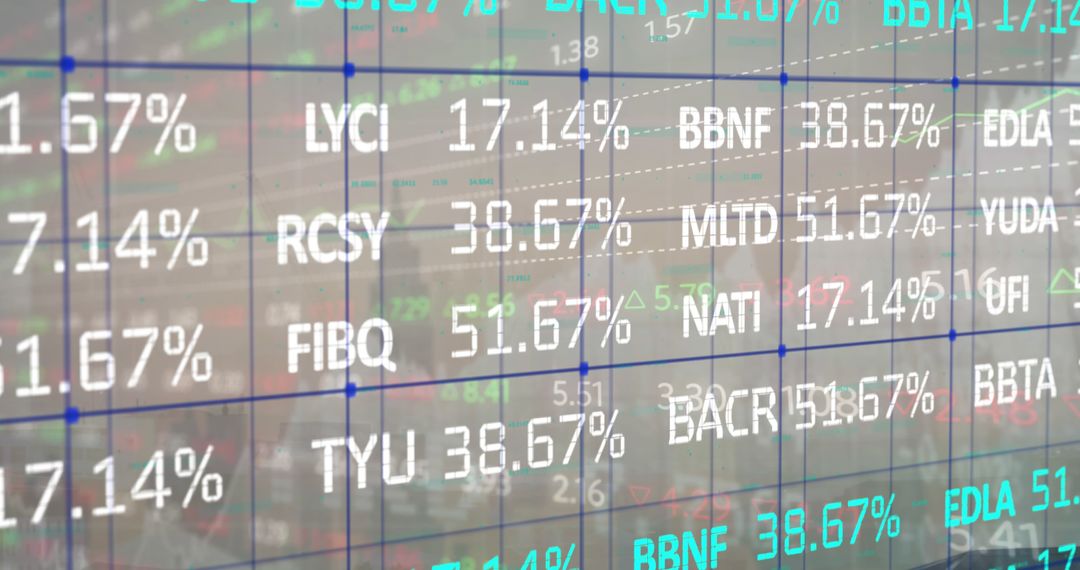
The visual displays digital stock market data with overlapping graphs indicating various financial trends. It uses a clean and structured layout to represent real-time information and changes, featuring numerical highlights and lines indicating market changes. This compelling visual encompasses abstract finance concepts and global economic activities. Perfect for presentations, business reports, investment newsletters, and educational materials related to finance and economics.
Powered by 


2
downloads
downloads
Tags:
More
Credit Photo
If you would like to credit the Photo, here are some ways you can do so
Text Link
photo Link
<span class="text-link">
<span>
<a target="_blank" href=https://pikwizard.com/photo/digital-stock-market-data-display-with-analytical-graphs/98b4b2022353475c16d0688eb13d267f/>PikWizard</a>
</span>
</span>
<span class="image-link">
<span
style="margin: 0 0 20px 0; display: inline-block; vertical-align: middle; width: 100%;"
>
<a
target="_blank"
href="https://pikwizard.com/photo/digital-stock-market-data-display-with-analytical-graphs/98b4b2022353475c16d0688eb13d267f/"
style="text-decoration: none; font-size: 10px; margin: 0;"
>
<img src="https://pikwizard.com/pw/medium/98b4b2022353475c16d0688eb13d267f.jpg" style="margin: 0; width: 100%;" alt="" />
<p style="font-size: 12px; margin: 0;">PikWizard</p>
</a>
</span>
</span>
Free (free of charge)
Free for personal and commercial use.
Author: Authentic Images
Similar Free Stock Images

Premium


Premium


Premium


Premium


Premium


Premium


Premium


Premium


Premium


Premium


Premium


Premium


Premium


Premium


Premium


Premium


Premium


Premium


Premium


Premium


Premium


Premium


Premium


Premium